5: Structure determination, part II: Nuclear magnetic resonance spectroscopy
Contents
5: Structure determination, part II: Nuclear magnetic resonance spectroscopy#
revise: add
(credit: https://www.flickr.com/photos/reighleblanc/)
One morning in a suburb of Edinburgh, Scotland, an active, athletic teenager named Charli found that she did not have her usual appetite for breakfast. She figured she was just feeling a little under the weather, and was not to worried. But as the days passed, her appetite did not return. Before long, she stopped eating lunch as well, and eventually she was hardly eating anything at all. She had to withdraw from her soccer team because she didn’t have enough energy to make it through the practices. When her weight began to drop alarmingly and she began to suffer from crippling headaches, her parents took her to her doctor, who diagnosed a glandular disorder.
To make things worse, Charli started getting teased at her school, enduring constant comments from other kids about her weight loss and gossip about an eating disorder. Almost two years went by, filled with doctors visits and various diagnoses and treatments, none of which were effective.
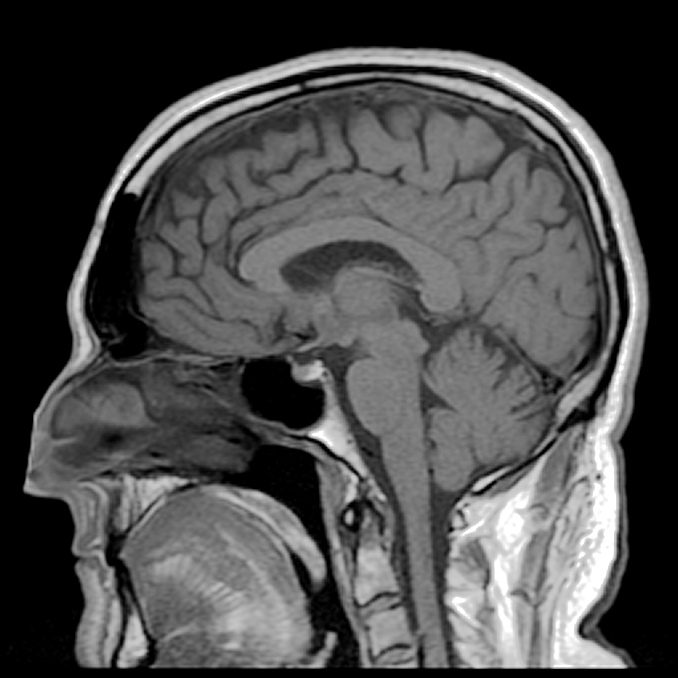
Finally, on a September day when Charli was fifteen, things came to a head. She was rushed to the hospital after suffering a massive stroke. Once she was stabilized, her doctors ordered an MRI scan of her brain. The images showed that she had a large tumor in her brain – it was benign, but its sheer size and the pressure it exerted had been enough to cause the devastating symptoms that Charli had been suffering for the past year and a half. Her doctors told her that if the tumor had not been detected, it could eventually have been fatal. After enduring an 8-hour brain surgery, Charli finally was able to start down her road to recovery. Speaking later to a journalist, Charli said of her stroke, “it was the best thing that ever happened to me”.
***
In Austin, Texas, a 28 year-old man named Alex was fed up with the back pain he had been suffering, the result, he assumed, of the damage from some old sports injuries catching up to him. His friend John, who was a radiological technician, convinced him to come in for an MRI scan on the chance that doctors might be able to spot something that could lead to a treatment. Alex agreed, and took a day off work to come in to his friend’s clinic. With John at the controls, Alex tried to relax as he was slowly rolled into the claustrophobic MRI chamber. After finishing the scan of his friend’s back and saving the images, John decided to ask a little favor. He had just installed some new software for head scans and needed to test it out on an actual subject, so he asked Alex if he would mind lying still for just a few minutes more so that he could take a test scan of his head. Unlike x-rays and CAT scans, the MRI procedure does not subject patients to potentially harmful radiation - just strong but harmless magnetic fields combined with radio waves – so there was no risk to undergoing an unnecessary scan. Alex agreed, and John proceeded with the test scan.
When the first image appeared, John was alarmed by what he saw. The new software was working just fine, but there was an ominous-looking lump behind Alex’s right eye that should not have been there. Not wanted to scare his friend unduly, he merely mentioned that he thought he might have seen something that should be checked out by a neurologist. Alex was feeling fine other than the back pain – no headaches, blurred vision, or dizziness, so it was probably nothing at all to worry about.
It turned out that Alex had a golf ball-sized brain tumor. His neurologist told him that because it happened to be located in an area of the brain that was not responsible for any critical functions, he was not yet experiencing any symptoms. But if the tumor had remained undetected for a few more years, it would have continued to grow and begun to press on other areas of Alex’s brain - and at that point, it probably would have been very difficult to remove safely.
Alex underwent a successful surgery to remove the tumor and was able to go on with his life, thanks to having an observant friend in the right place at the right time, with access to a powerful diagnostic technology.
***
The common denominator in these two stories – and in countless others from around the world – is the power of MRI to detect hidden but deadly medical problems, without causing any harm or pain to the patient. In this chapter, we are going to learn about an analytical tool used by organic chemists called nuclear magnetic resonance (NMR) spectroscopy, which works by the same principles as an MRI scanner in a hospital. While doctors use MRI peer inside the human body, we will see how NMR allows chemists to piece together, atom by atom and bond by bond, the structure of an organic molecule.
5.1: The source of the NMR signal#
5.1A: The magnetic moment#
Nuclear magnetic resonance spectroscopy is an incredibly powerful tool for organic chemists because it allows us to analyze the connectivity of carbon and hydrogen atoms in molecules. The basis for NMR is the observation that many atomic nuclei generate their own magnetic field, or magnetic moment, as they spin about their axes. Not all nuclei have a magnetic moment. Fortunately for organic chemists, though, hydrogen (1H), the 13C isotope of carbon, the 19F isotope of fluorine, and the 31P isotope of phosphorus all have magnetic moments and therefore can be observed by NMR – they are, in other words, NMR-active. Other nuclei - such as the common 12C and 16O isotopes of carbon and oxygen - do not have magnetic moments, and cannot be directly observed by NMR. Still other nuclei such as the hydrogen isotope deuterium (2H) and nitrogen (14N) have magnetic moments and are NMR-active, but the nature of their magnetic moments is such that analysis of these nuclei by NMR is more complex.
In practice it is 1H and 13C nuclei that are most commonly observed by NMR spectroscopy, and it is on those techniques that we will focus in this chapter, beginning with 1H-NMR. The terms ‘proton’ and ‘hydrogen’ are used interchangeably when discussing because the 1H nucleus is just a single proton.
Some examples of magnetic and nonmagnetic nuclei relevant
to biological organic chemistry
Magnetic nuclei |
Nonmagnetic nuclei |
|---|---|
1H |
12C |
2H |
16O |
13C |
32S |
14N |
|
19F |
|
31P |
5.1B: Spin states and the magnetic transition#
When a sample of an organic compound is sitting in a flask on a laboratory bench, the magnetic moments of all of its protons are randomly oriented. However, when the same sample is placed within the field of a very strong superconducting magnet (this field is referred to by NMR spectroscopists as the applied field, abbreviated B0 ) each proton will assume one of two possible quantum spin states. In the +½ spin state, the proton’s magnetic moment is aligned with the direction of B0, while in the -½ spin state it is aligned opposed to the direction of B0.
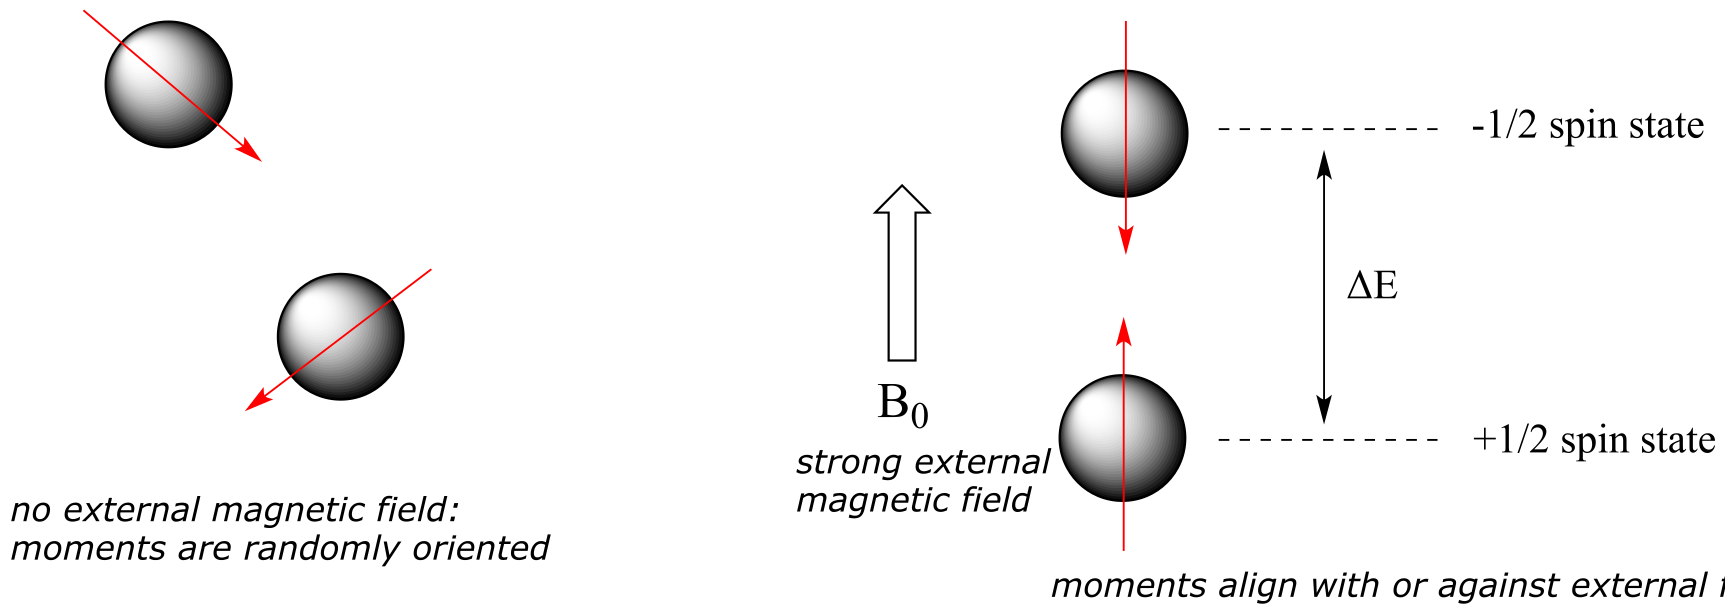
fig 1
The +½ spin state is slightly lower in energy than the -½ state, and the energy gap between them, which we will call ∆E, depends upon the strength of B0: a stronger applied field results in a larger ∆E. For a large population of organic molecules in an applied field, slightly more than half of the protons will occupy the lower energy +½ spin state, while slightly less than half will occupy the higher energy -½ spin state. It is this population difference (between the two spin states) that is exploited by NMR, and the difference increases with the strength of the applied magnetic field.
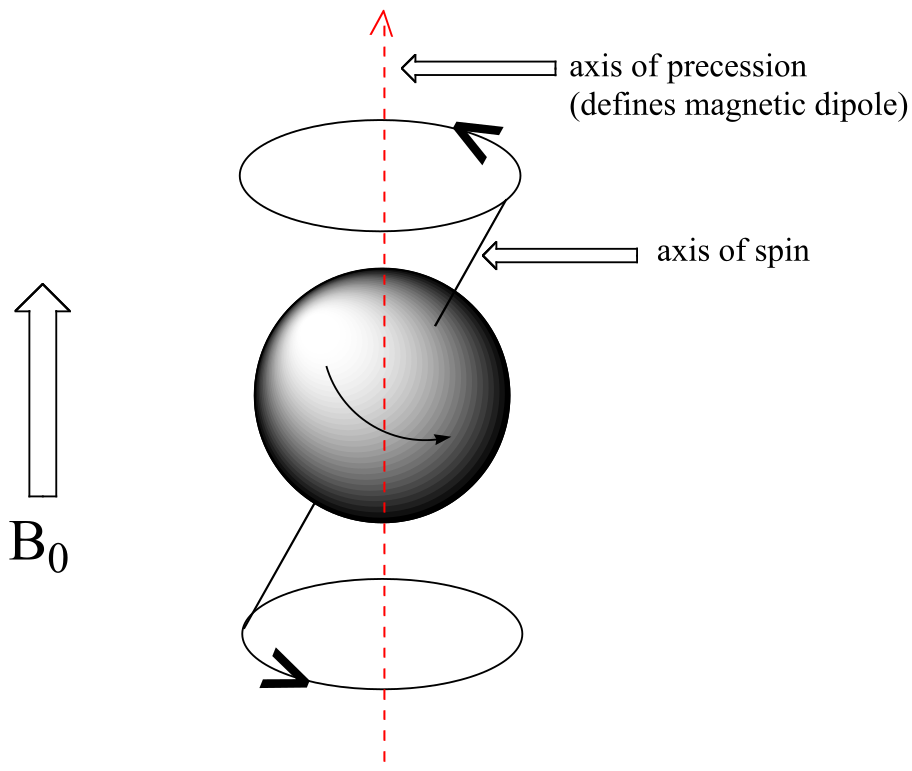
At this point, we need to look a little more closely at how a proton spins in an applied magnetic field. You may recall playing with spinning tops as a child. When a top slows down a little and the spin axis is no longer completely vertical, it begins to exhibit precessional motion, as the spin axis rotates slowly around the vertical. In the same way, hydrogen atoms spinning in an applied magnetic field also exhibit precessional motion about a vertical axis. It is this axis (which is either parallel or antiparallel to B0) that defines the proton’s magnetic moment.
Watch the first minute or so of this video of spinning tops:
look for the precessional motion
The frequency of precession (also called the Larmour frequency, abbreviated νL) is simply the number of times per second that the proton precesses in a complete circle. A proton`s precessional frequency increases with the strength of B0.
If a proton that is precessing in an applied magnetic field is exposed to electromagnetic radiation of a frequency ν that matches its precessional frequency νL, we have a condition called resonance. In the resonance condition, a proton in the lower-energy +½ spin state (aligned with B0) will transition (flip) to the higher energy –½ spin state (opposed to B0). In doing so, it will absorb radiation at this resonance frequency ν - and this frequency corresponds to ∆E, the energy difference between the proton’s two spin states. With the strong magnetic fields generated by the superconducting magnets used in modern NMR instruments, the resonance frequency for protons falls within the radio-wave range, anywhere from 100 MHz to 800 MHz depending on the strength of the magnet.
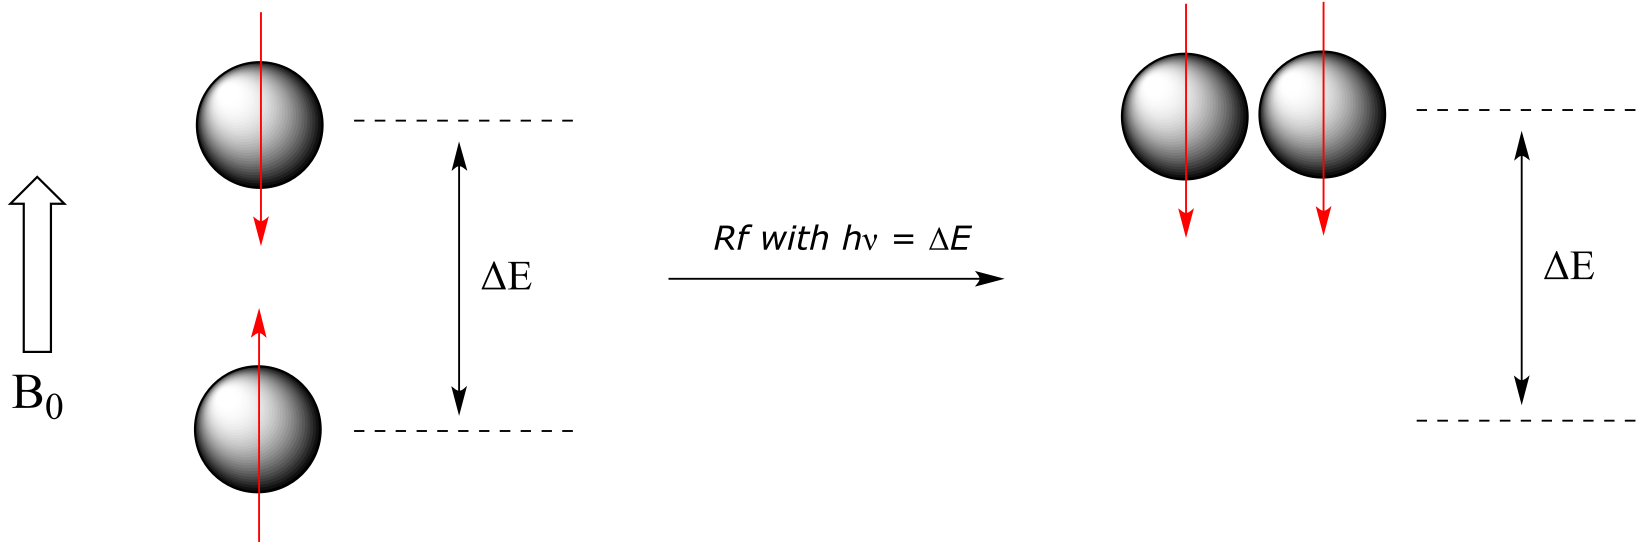
fig 2
Think back for a moment to the other two spectroscopic techniques we have learned about: IR and UV-Vis spectroscopy. Recall from section 4.2 that photons of electromagnetic radiation of a given frequency correspond to energy (E) given by E = hν, where h is Plank’s constant and ν is the frequency in waves per second, or Hz. Recall also from section 4.3 that the energy gap between vibrational states corresponds to the energy associated with infrared radiation, and from section 4.4 that the energy gap between electronic states in conjugated π-bonding systems corresponds to the energy associated with light in the ultraviolet and visible regions of the electromagnetic spectrum. Now, we know that in NMR, the energy gap ∆E between the +½ and -½ spin states of an atomic nucleus in a strong magnetic field corresponds to the energy associated with radiation in the radio frequency (Rf) region of the spectrum.
By detecting the frequency of Rf radiation that is absorbed, we can gain information about the chemical environment of protons in an organic molecule.
Exercise 5.1: In a general sense, how big is the energy gap for the nuclear spin transition observed in NMR compared to the energy gap for the vibrational transition observed in IR spectroscopy? Much bigger? Much smaller? Slightly bigger or smaller? About the same? How can you tell from the information presented in this section?
5.2: Chemical equivalence#
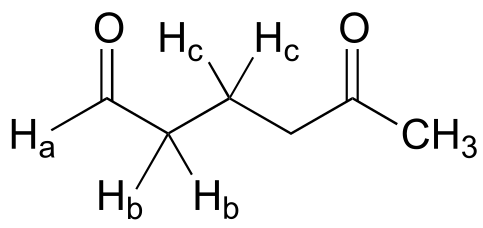
The frequency of radiation absorbed by a proton (or any other nucleus) during a spin transition in an NMR experiment is called its ‘resonance frequency’. If all protons in all organic molecules had the same resonance frequency, NMR spectroscopy but would not be terribly useful for chemists. Fortunately for us, however, resonance frequencies are not uniform for different protons in a molecule - rather, the resonance frequency varies according to the electronic environment that a given proton inhabits. In methyl acetate, for example, there are two distinct ‘sets’ of protons.
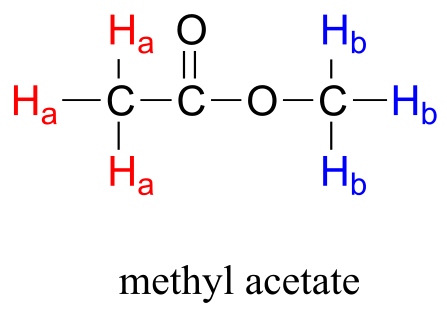
fig 3
The three methyl acetate protons labeled Ha above have a different resonance frequency compared to the three Hb protons, because the two sets of protons are in non-identical electronic environments: the Ha protons are on a carbon next to a carbonyl carbon, while the Hb protons or on a carbon next to the an oxygen. In the terminology of NMR, all three Ha protons are chemically equivalent to each other, as are all three Hb protons. The Ha protons are, however, chemically nonequivalent to the Hb protons. As a consequence, the resonance frequency of the Ha protons is different from that of the Hb protons. For now, do not worry about why the different electronic environment gives rise to different resonance frequencies - we will get to that soon.
The ability to recognize chemical equivalancy and nonequivalency among atoms in a molecule will be central to understanding NMR. Each of the molecules below contains only one set of chemically equivalent protons: all six protons on benzene, for example, are equivalent to each other and have the same resonance frequency in an NMR experiment. Notice that any description of the bonding and position of one proton in benzene applies to all five other protons as well.
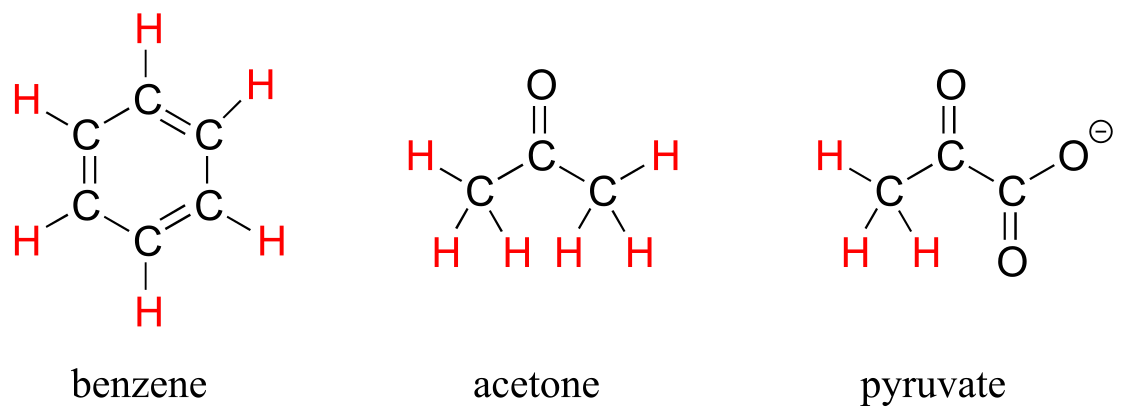
fig 4
Each of the molecules in the next figure contains two sets of chemically equivalent protons, just like our previous example of methyl acetate, and again in each case the resonance frequency of the Ha protons will be different from that of the Hb protons.
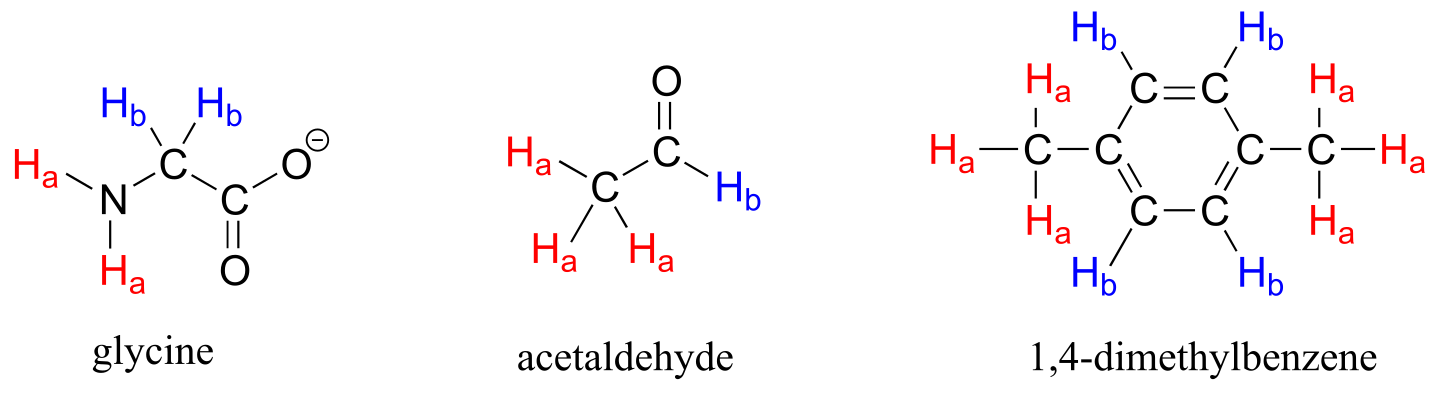
fig 5
Take acetaldehyde as an example: a description of the bonding and position of the Hb proton does not apply to the three Ha protons: Hb is bonded to an *sp2-*hybridized carbonyl carbon while the Ha protons are bonded to an sp3-hybridized methyl carbon.
Note that while all four aromatic protons in 1,4-dimethylbenzene are chemically equivalent, its constitutional isomer 1,2 dimethylbenzene has two sets of aromatic protons in addition to the six methyl (Ha) protons. The 1,3-substituted isomer, on the other hand, has three sets of aromatic protons.
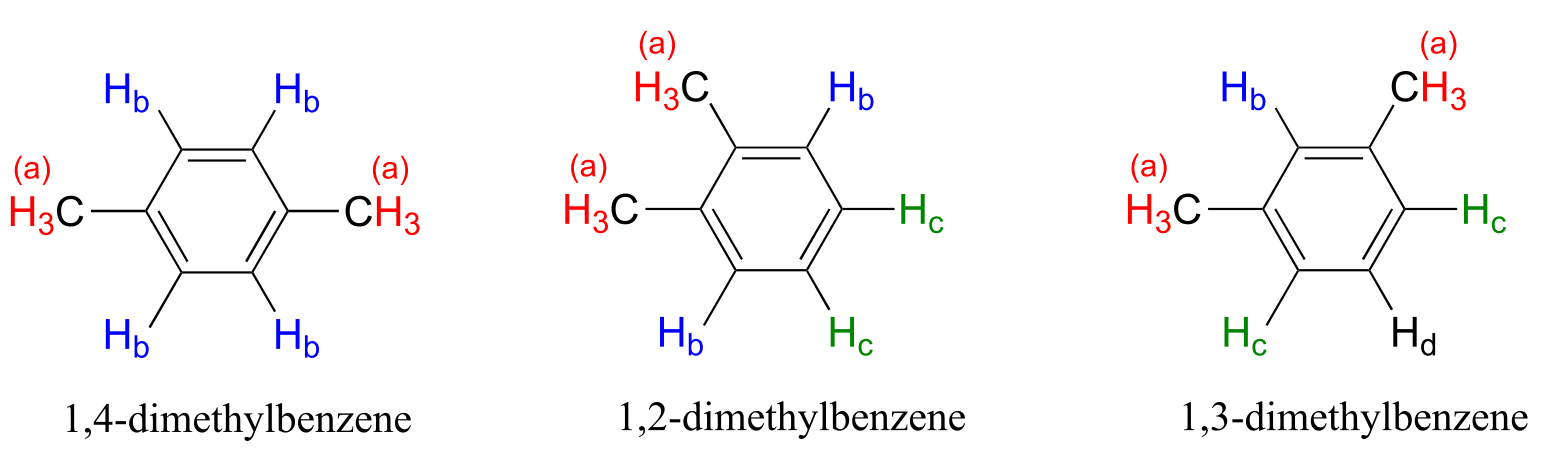
fig 5b
In 1,2-dimethylbenzene, both Hb protons are adjacent to a methyl substituent, while both Hc protons are two carbons away. In 1,3-dimethylbenzene, Hb is situated between two methyl groups, the two Hc protons are one carbon away from a methyl group, and Hd is two carbons away from a methyl group.
As you have probably already realized, chemical equivalence or non-equivalence in NMR is closely related to symmetry. Different planes of symmetry in the three isomers of dimethylbenzene lead to different patterns of equivalence.
Stereochemistry can play a part in determining equivalence or nonequivalence of nuclei in NMR. In the chloroethene (commonly known as vinyl chloride, the compound used to make polyvinyl chloride or PVC), Ha and Hb are in nonequivalent electronic environments, because Ha is cis to the chlorine atom while Hb is trans. Likewise, Ha and Hb in chlorocyclopropane are nonequivalent due to their positions either on the same or opposite side of the ring relative to chlorine.
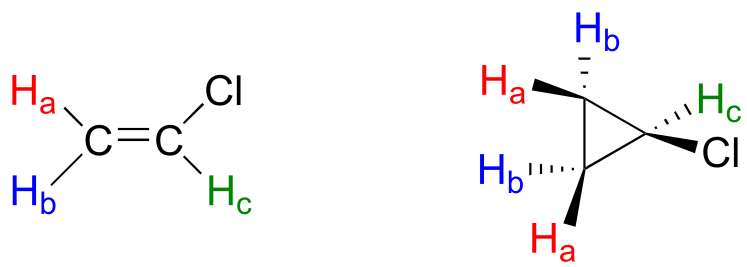
fig 5a
Note: If you think back to our discussion of prochirality in section 3.11, you should recognize that the Ha and Hb protons in the examples above are diastereotopic pairs. In fact, all diastereotopic protons are technically non-equivalent in terms of their chemical shift in an NMR experiment. For example, the pro-R and pro-S protons in (R)-2-butanol (below) are diastereotopic, and for reasons that are beyond the scope of our discussion here, it turns out that they are in slightly different electronic environments, and thus have slightly different chemical shifts - they are chemically non-equivalent.
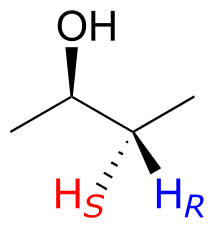
However, in actual practice, the difference in chemical shift between two diastereotopic protons such as these - bonded to the same sp3-hybridized carbon and not part of a ring - is usually so small that they appear to be equivalent. There are exceptions, of course, but for the sake of simplicity, in this book we will consider such protons to be chemically equivalent. The chemical non-equivalence of diastereotopic protons usually only becomes pronounced when they are bonded to alkene or ring carbons, as in the previous examples.
Most organic molecules have several sets of protons in different chemical environments, and each set will have a different resonance frequency in 1H-NMR spectroscopy. Below we see some examples of multiple sets of protons in biological molecules.
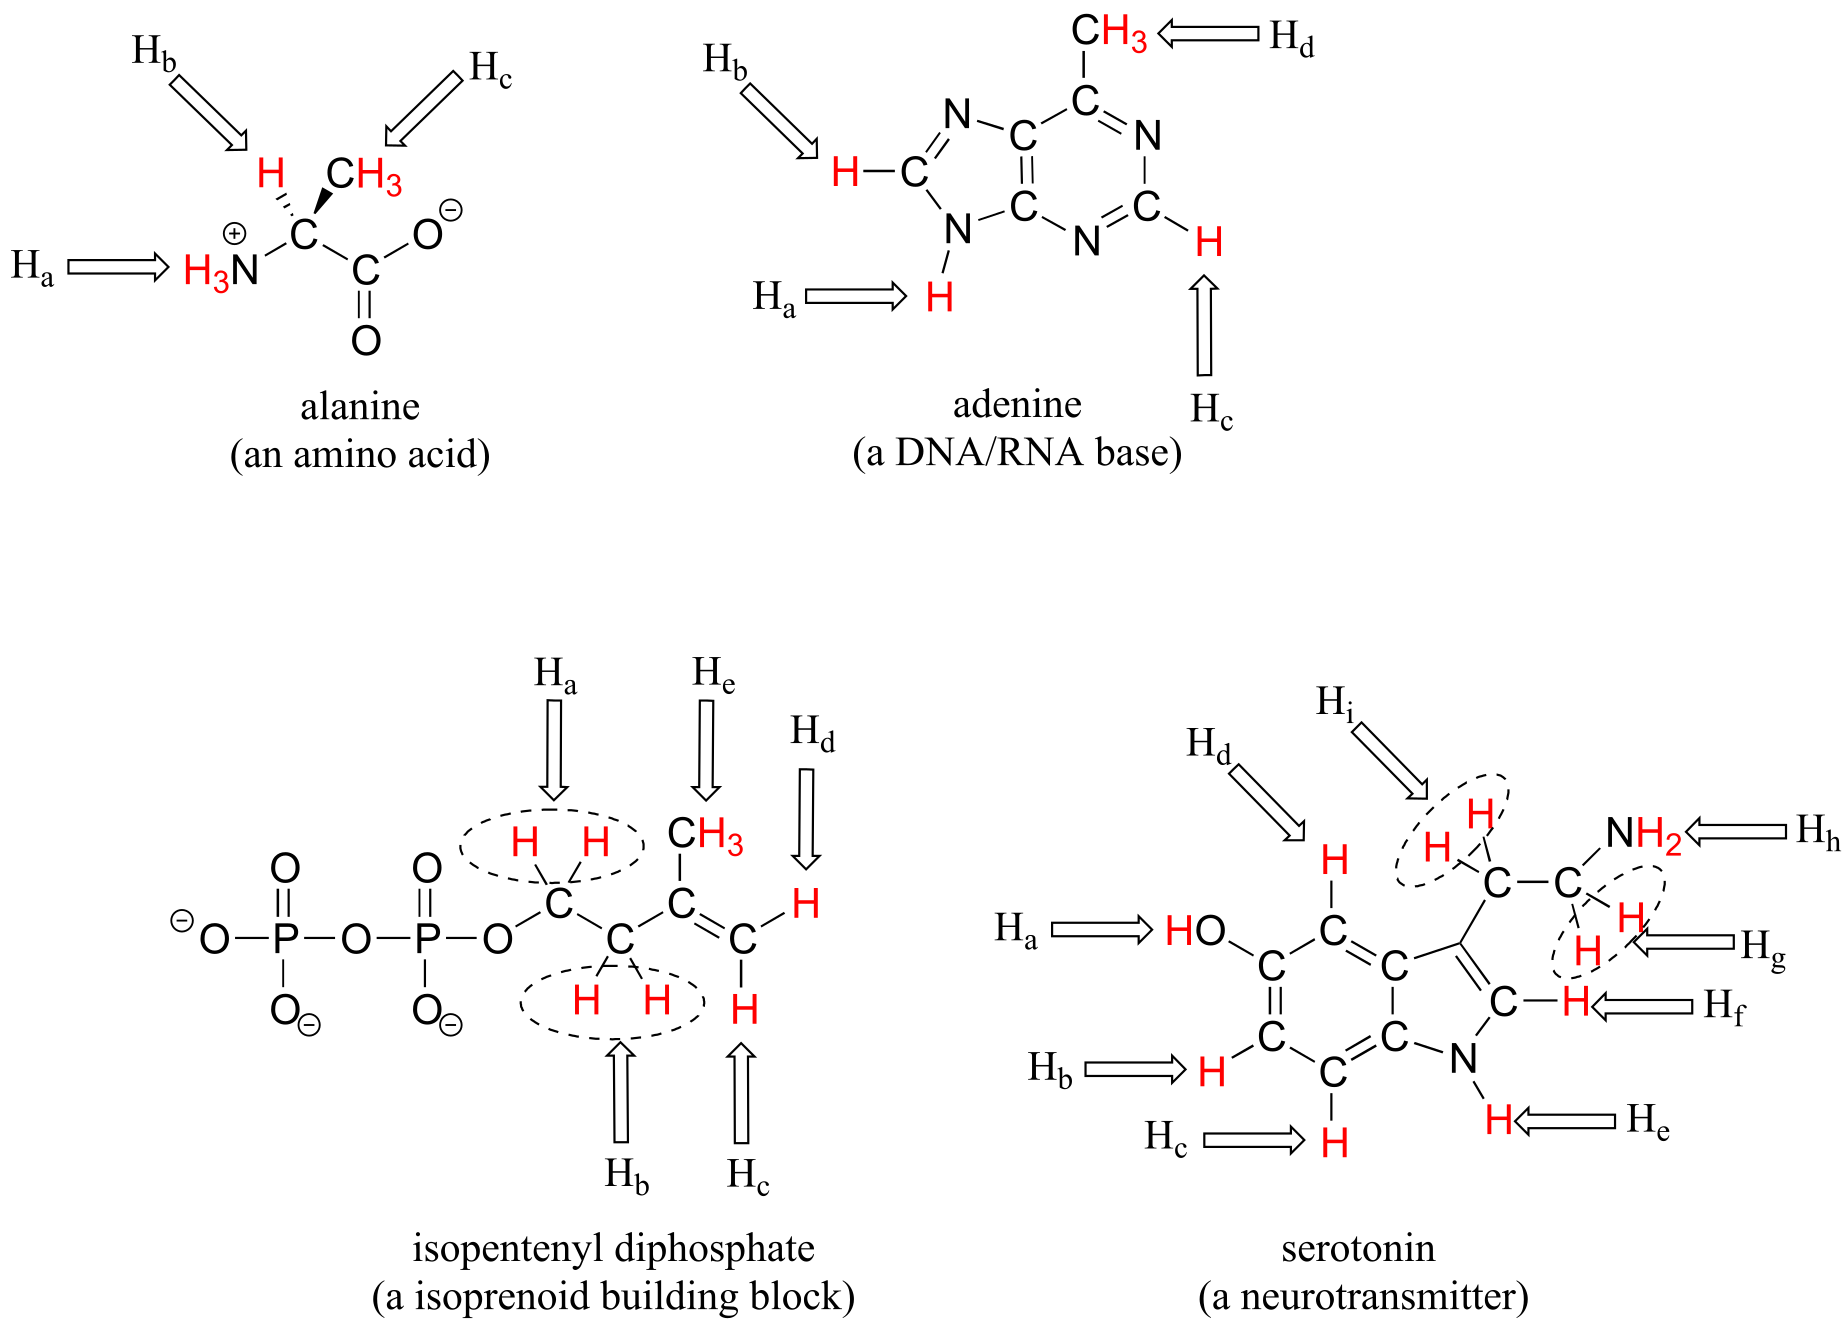
fig 6
(Note that protons Ha and Hb in isopentenyl diphosphate, and Hg and Hi in serotonin are all pairs of diastereotopic protons, but for the reason discussed in the shaded box above we are considering them to be chemically equivalent. We do consider the diastereotopic protons Hc and Hd in isopentenyl diphosphate, however, to be chemically nonequivalent.)
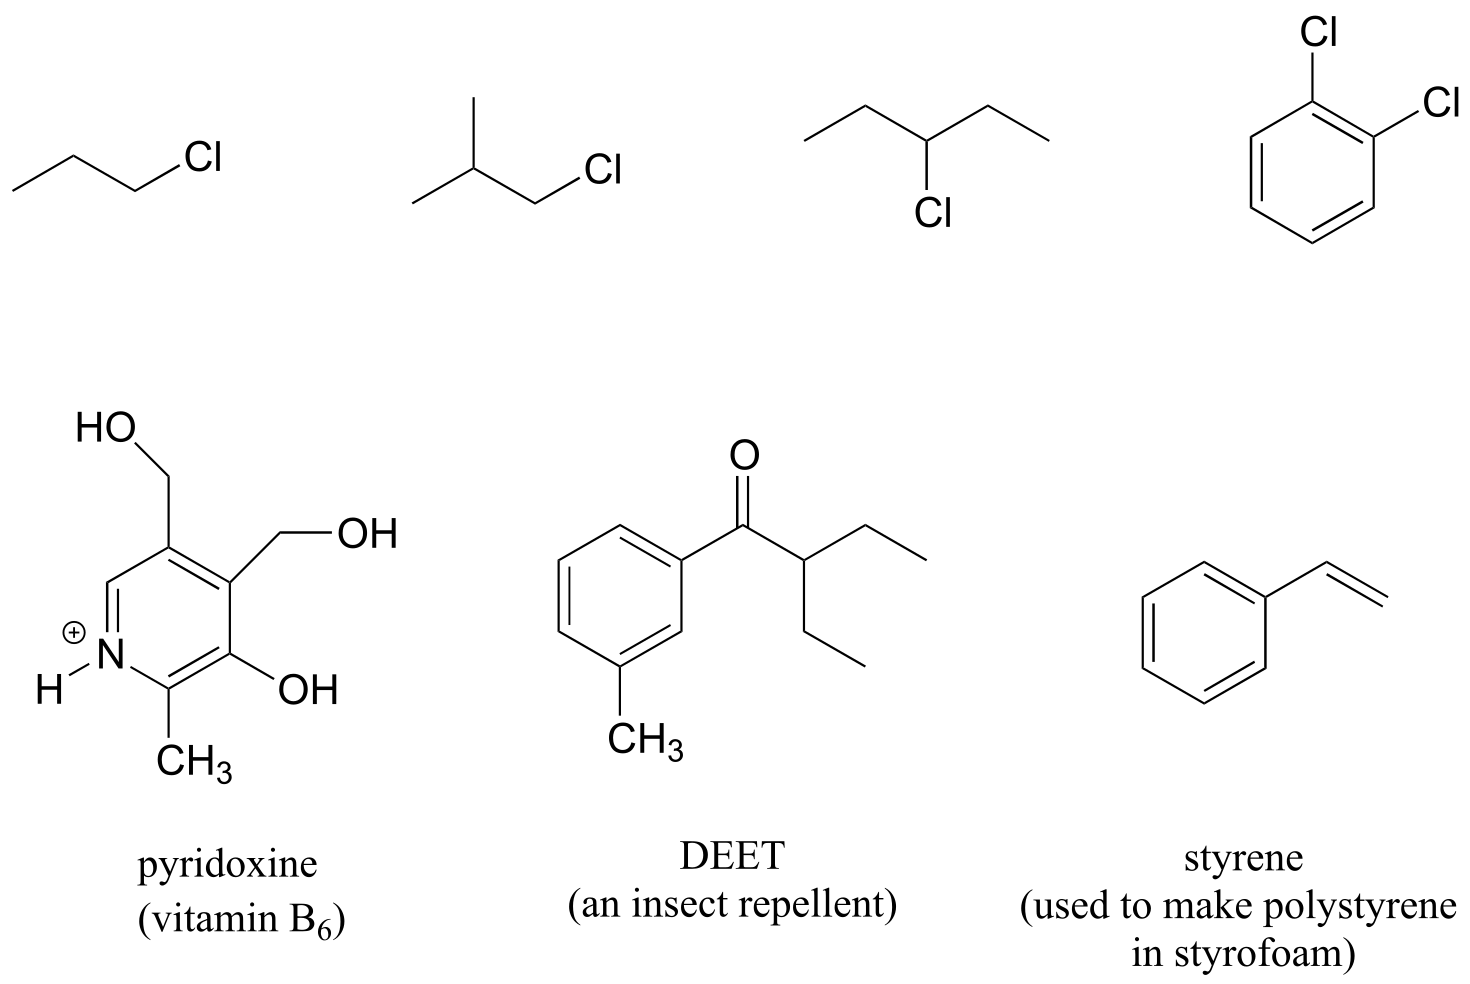
Exercise 5.2: How many sets of equivalent protons do the following molecules contain?
fig 7
5.3: The 1H-NMR experiment#
In an NMR experiment, a sample compound (we’ll again use methyl acetate as our example) is placed inside a very strong applied magnetic field (B0) generated by a superconducting magnet in the instrument. (The magnetic fields generated by modern NMR instruments are strong enough that users must take care to avoid carrying any magnetics objects anywhere near them. They are also notorious for erasing the magnetic strips on credit cards!)
fig 3
At first, the magnetic moments of (slightly more than) half of the protons in the sample are aligned with B0, and half are aligned against B0. Then, the sample is exposed to a range of radio frequencies. Out of all of the frequencies which hit the sample, only two - the resonance frequencies for Ha and Hb - are absorbed, causing those protons which are aligned with B0 to ‘spin flip’ so that they align themselves against B0. When the ‘flipped’ protons flip back down to their ground state, they emit energy, again in the form of radio-frequency radiation. The NMR instrument detects and records the frequency and intensity of this radiation, making using of a mathematical technique known as a ‘Fourier Transform’.
Note: the above description of an NMR experiment is an oversimplification of what is happening in a modern NMR instrument, but is adequate for our purpose here. If you take a more advanced course in molecular spectroscopy you will learn about the process is much greater detail.
In most cases, a sample being analyzed by NMR is in solution. If we use a common laboratory solvent (diethyl ether, acetone, dichloromethane, ethanol, water, etc.) to dissolve our NMR sample, however, we run into a problem – there many more solvent protons in solution than there are sample protons, so the signals from the sample protons will be overwhelmed. To get around this problem, we use special NMR solvents in which all protons have been replaced by deuterium. Deuterium is NMR-active, but its resonance frequency is far outside of the range in which protons absorb, so it is `invisible` in 1H-NMR. Some common NMR solvents are shown below.
Common NMR solvents
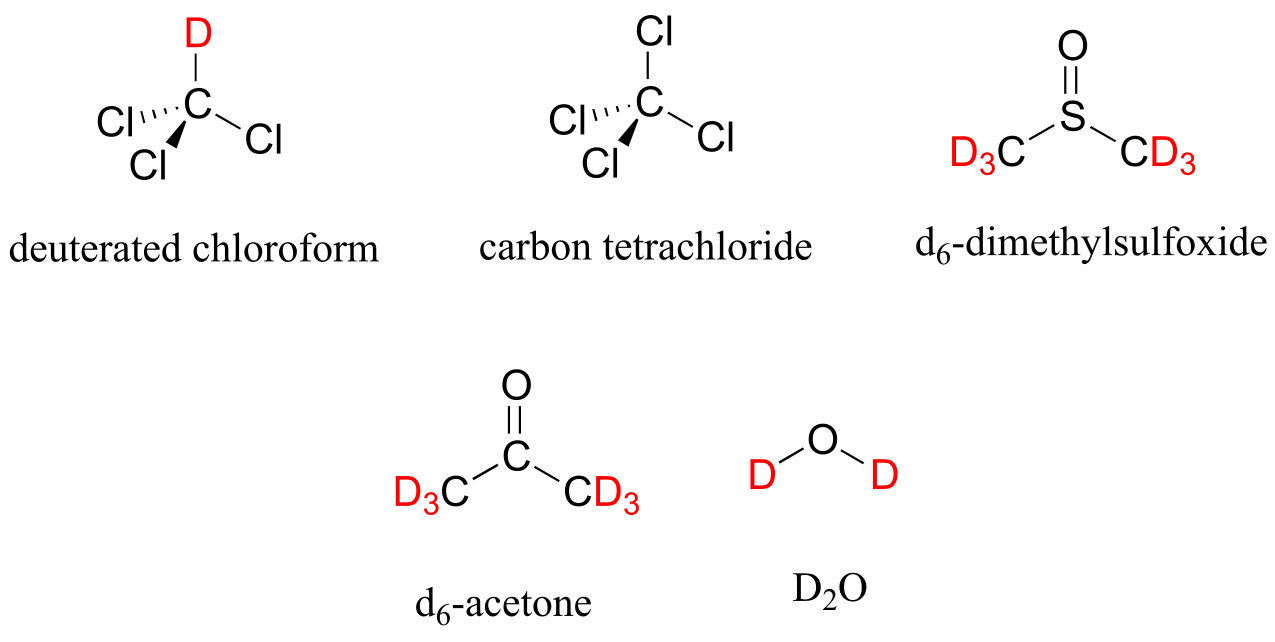
fig 8
Let’s look at an actual 1H-NMR spectrum for methyl acetate. Just as in IR and UV-vis spectroscopy, the vertical axis corresponds to intensity of absorbance, the horizontal axis to frequency. However, you will notice right away that a) there is no y-axis line or units drawn in the figure, and b) the x-axis units are not Hz, which you would expect for a frequency scale. Both of these mysteries will become clear very soon.
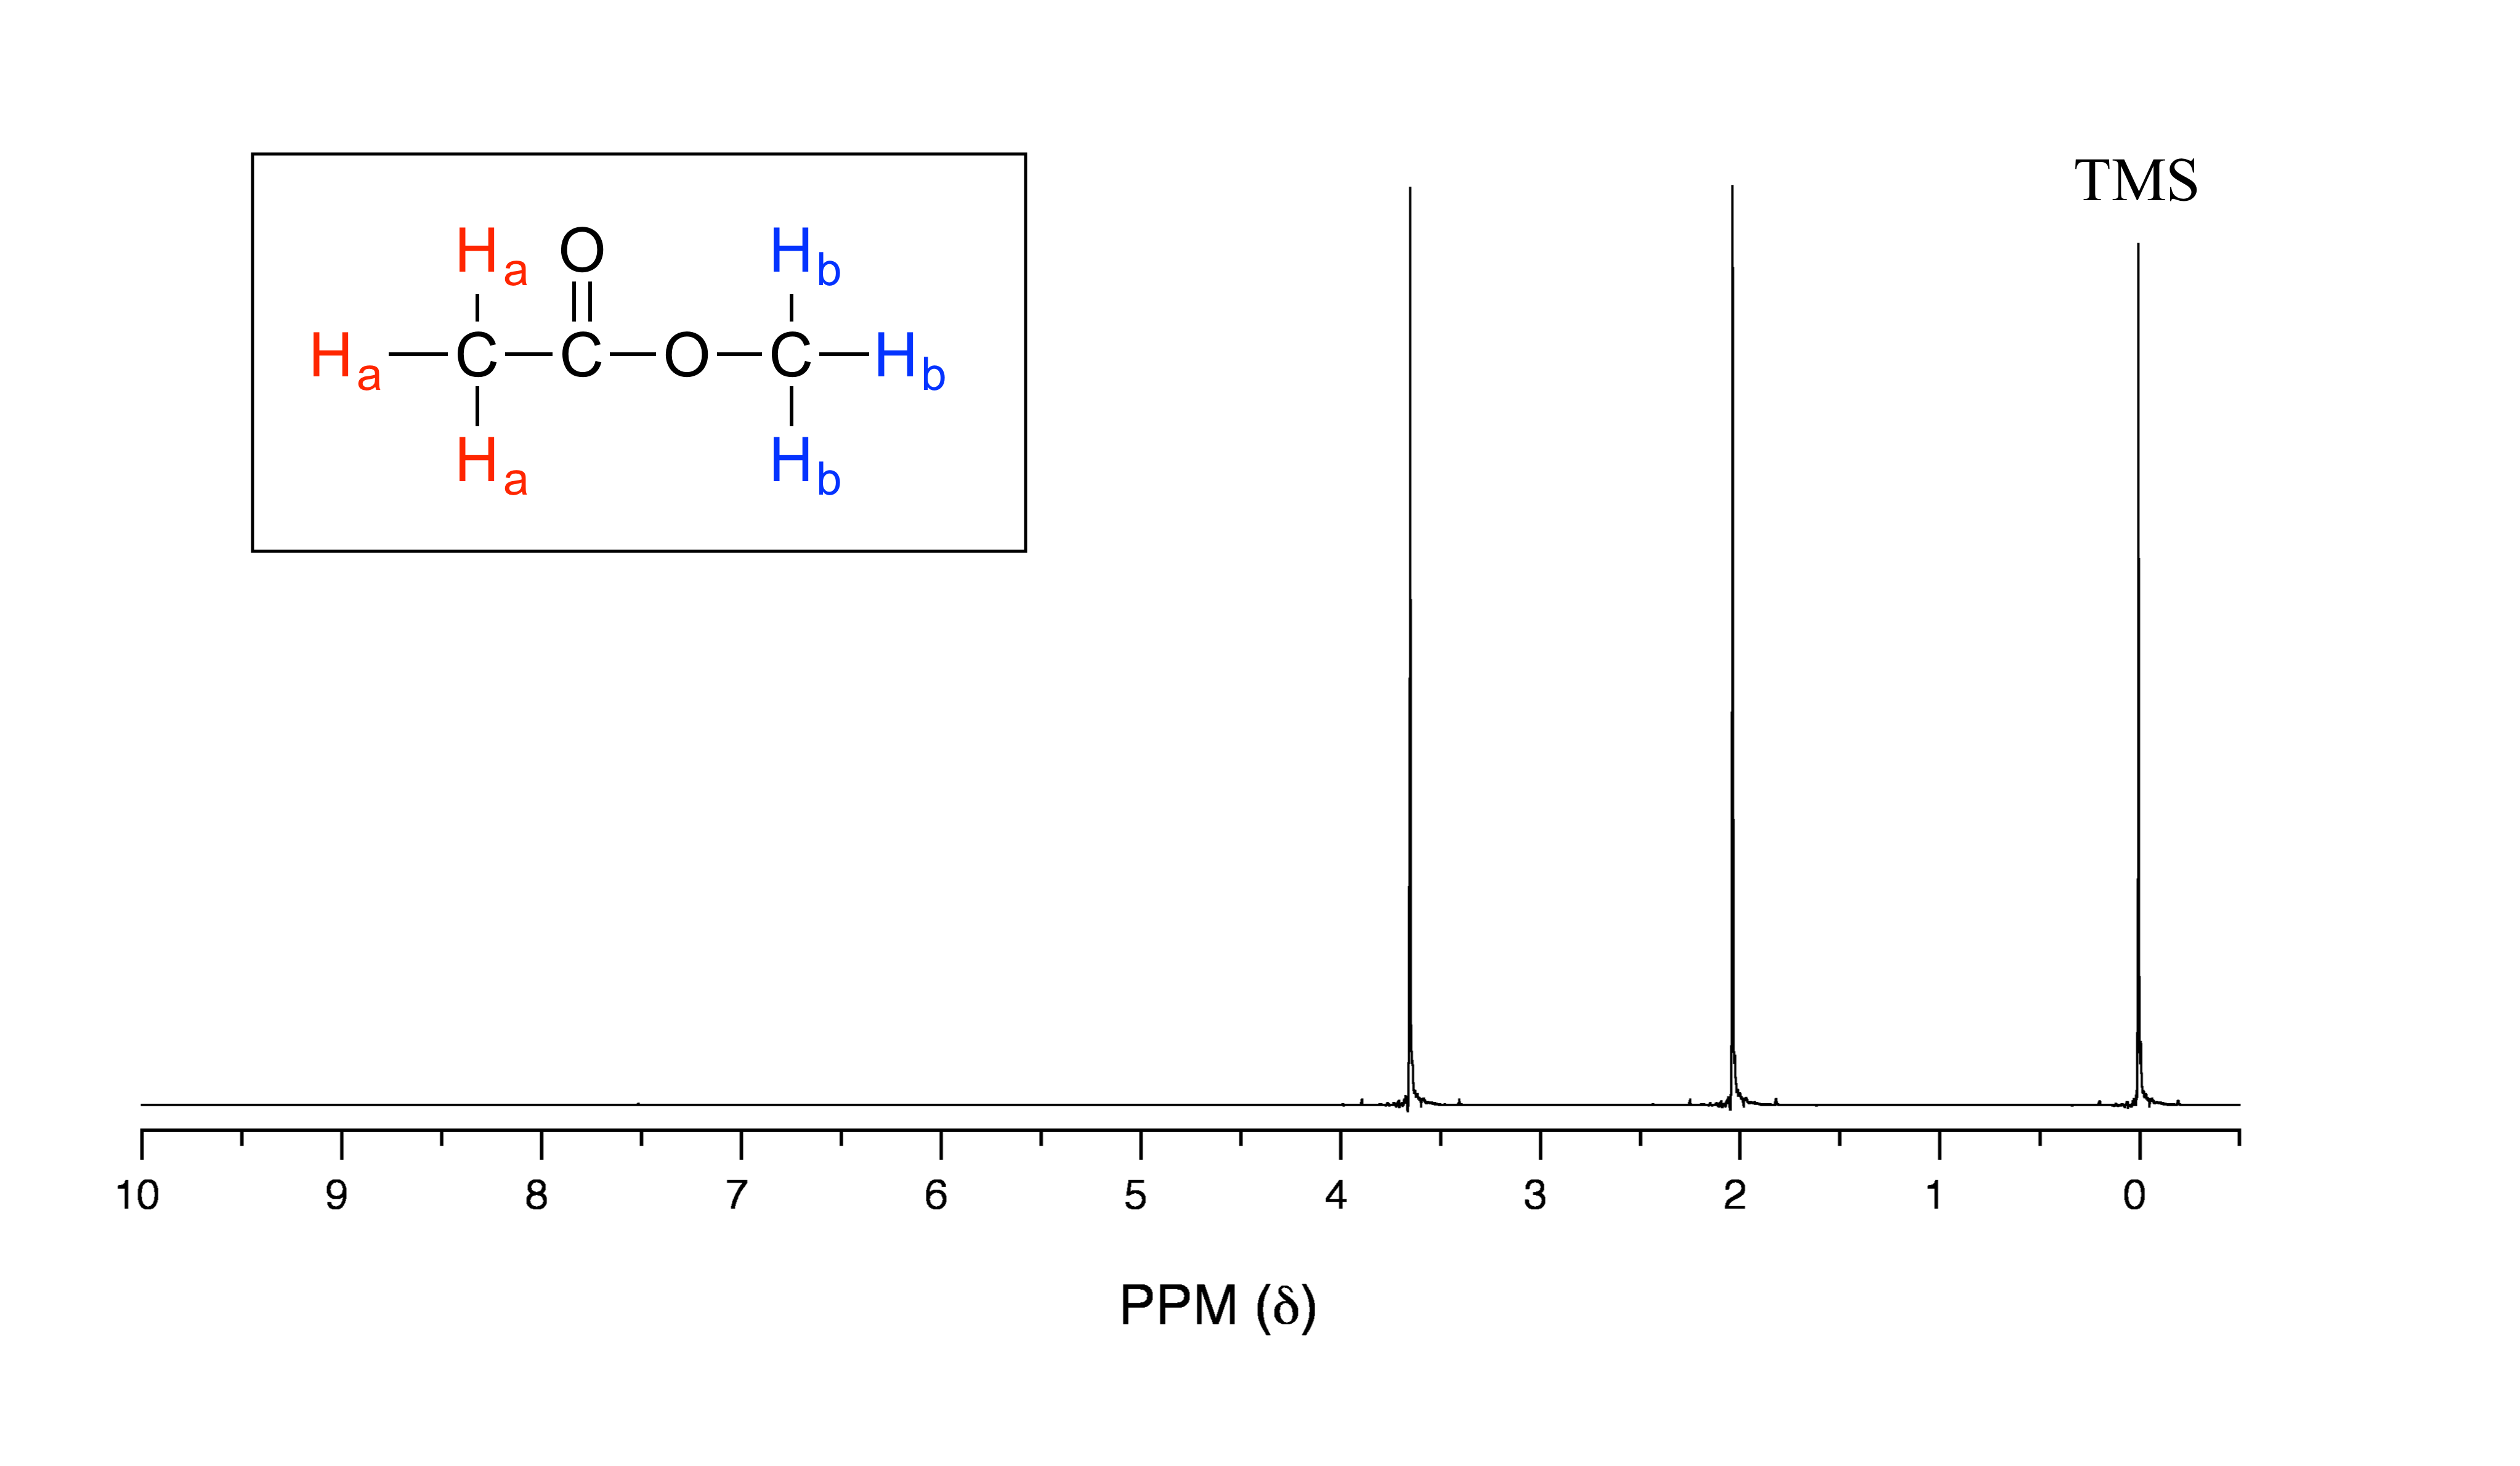
The 1H-NMR spectrum of methyl acetate
ig 9
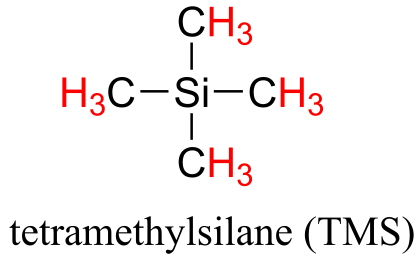
We see three absorbance signals: two of these correspond to Ha and Hb (don’t worry yet which is which), while the peak at the far right of the spectrum corresponds to the 12 chemically equivalent protons in tetramethylsilane (TMS), a standard reference compound that was added to our sample.
First, let’s talk about the x-axis. The ‘ppm’ label stands for ‘parts per million’, and simply tells us that the two sets of equivalent protons in our methyl acetate sample have resonance frequencies about 2.0 and 3.6 parts per million higher than the resonance frequency of the TMS protons, which we are using as our reference standard. This is referred to as their chemical shift.
The reason for using a relative value (chemical shift expressed in ppm) rather than the actual resonance frequency (expressed in Hz) is that every NMR instrument will have a different magnetic field strength, so the actual value of resonance frequencies expressed in Hz will be different on different instruments - remember that ∆E for the magnetic transition of a nucleus depends upon the strength of the externally applied magnetic field. However, the resonance frequency values relative to the TMS standard will always be the same, regardless of the strength of the applied field. For example, if the resonance frequency for the TMS protons in a given NMR instrument is exactly 300 MHz (300 million Hz), then a chemical shift of 2.0 ppm corresponds to an actual resonance frequency of 300,000,600 Hz (2 parts per million of 300 million is 600). In another instrument (with a stronger magnet) where the resonance frequency for TMS protons is 400 MHz, a chemical shift of 2.0 ppm corresponds to a resonance frequency of 400,000,800 Hz.
A frequently used symbolic designation for chemical shift in ppm is the lower-case Greek letter δ (delta). Most protons in organic compounds have chemical shift values between 0 and 10 ppm relative to TMS, although values below 0 ppm and up to 12 ppm and above are occasionally observed. By convention, the left-hand side of an NMR spectrum (higher chemical shift) is called downfield, and the right-hand direction is called upfield.
In modern research-grade NMR instruments, it is no longer necessary to actually add TMS to the sample: the computer simply calculates where the TMS signal should be, based on resonance frequencies of the solvent. So, from now on you will not see a TMS peak on NMR spectra - but the 0 ppm point on the x-axis will always be defined as the resonance frequency of TMS protons.
A Chemical Shift Analogy
If you are having trouble understanding the concept of chemical shift and why it is used in NMR, try this analogy: imagine that you have a job where you travel frequently to various planets, each of which has a different gravitational field strength. Although your body mass remains constant, your measured weight is variable - the same scale may show that you weigh 60 kg on one planet, and 75 kg on another. You want to be able to keep track your body mass in a meaningful, reproducible way, so you choose an object to use as a standard: a heavy iron bar, for example. You record the weight of the iron bar and yourself on your home planet, and find that the iron bar weighs 50 kg and you weigh 60 kg. You are 20 percent (or pph, parts per hundred) heavier than the bar. The next day you travel (with the iron bar in your suitcase) to another planet and find that the bar weighs 62.5 kg, and you weigh 75 kg. Although your measured weight is different, you are still 20% heavier than the bar: you have a ‘weight shift’ of 20 pph relative to the iron bar, no matter what planet you are on.
Exercise 5.3:
a) What is the chemical shift, expressed in Hz, of proton signals at 2.0 ppm and 3.6 ppm for an NMR instrument in which the TMS protons have a resonance frequency of exactly 500 MHz?
b) What is the actual resonance frequency (in Hz) of these two protons in that same instrument?
We have already pointed out that, on our spectrum of methyl acetate, there is there is no y-axis scale indicated. With y-axis data it is relative values, rather than absolute values, that are important in NMR. The computer in an NMR instrument can be instructed to mathematically integrate the area under a signal or group of signals. The signal integration process is very useful, because in 1H-NMR spectroscopy the area under a signal is proportional to the number of protons to which the signal corresponds. When we instruct the computer to integrate the areas under the Ha and Hb signals in our methyl acetate spectrum, we find that they have approximately the same area. This makes sense, because each signal corresponds to a set of three equivalent protons.
Be careful not to assume that you can correlate apparent peak height to number of protons - depending on the spectrum, relative peak heights will not always be the same as relative peak areas, and it is the relative areas that are meaningful. Because it is difficult to compare relative peak area by eye, we rely on the instrument’s computer to do the calculations.
Take a look next at the spectrum of 1,4-dimethylbenzene:
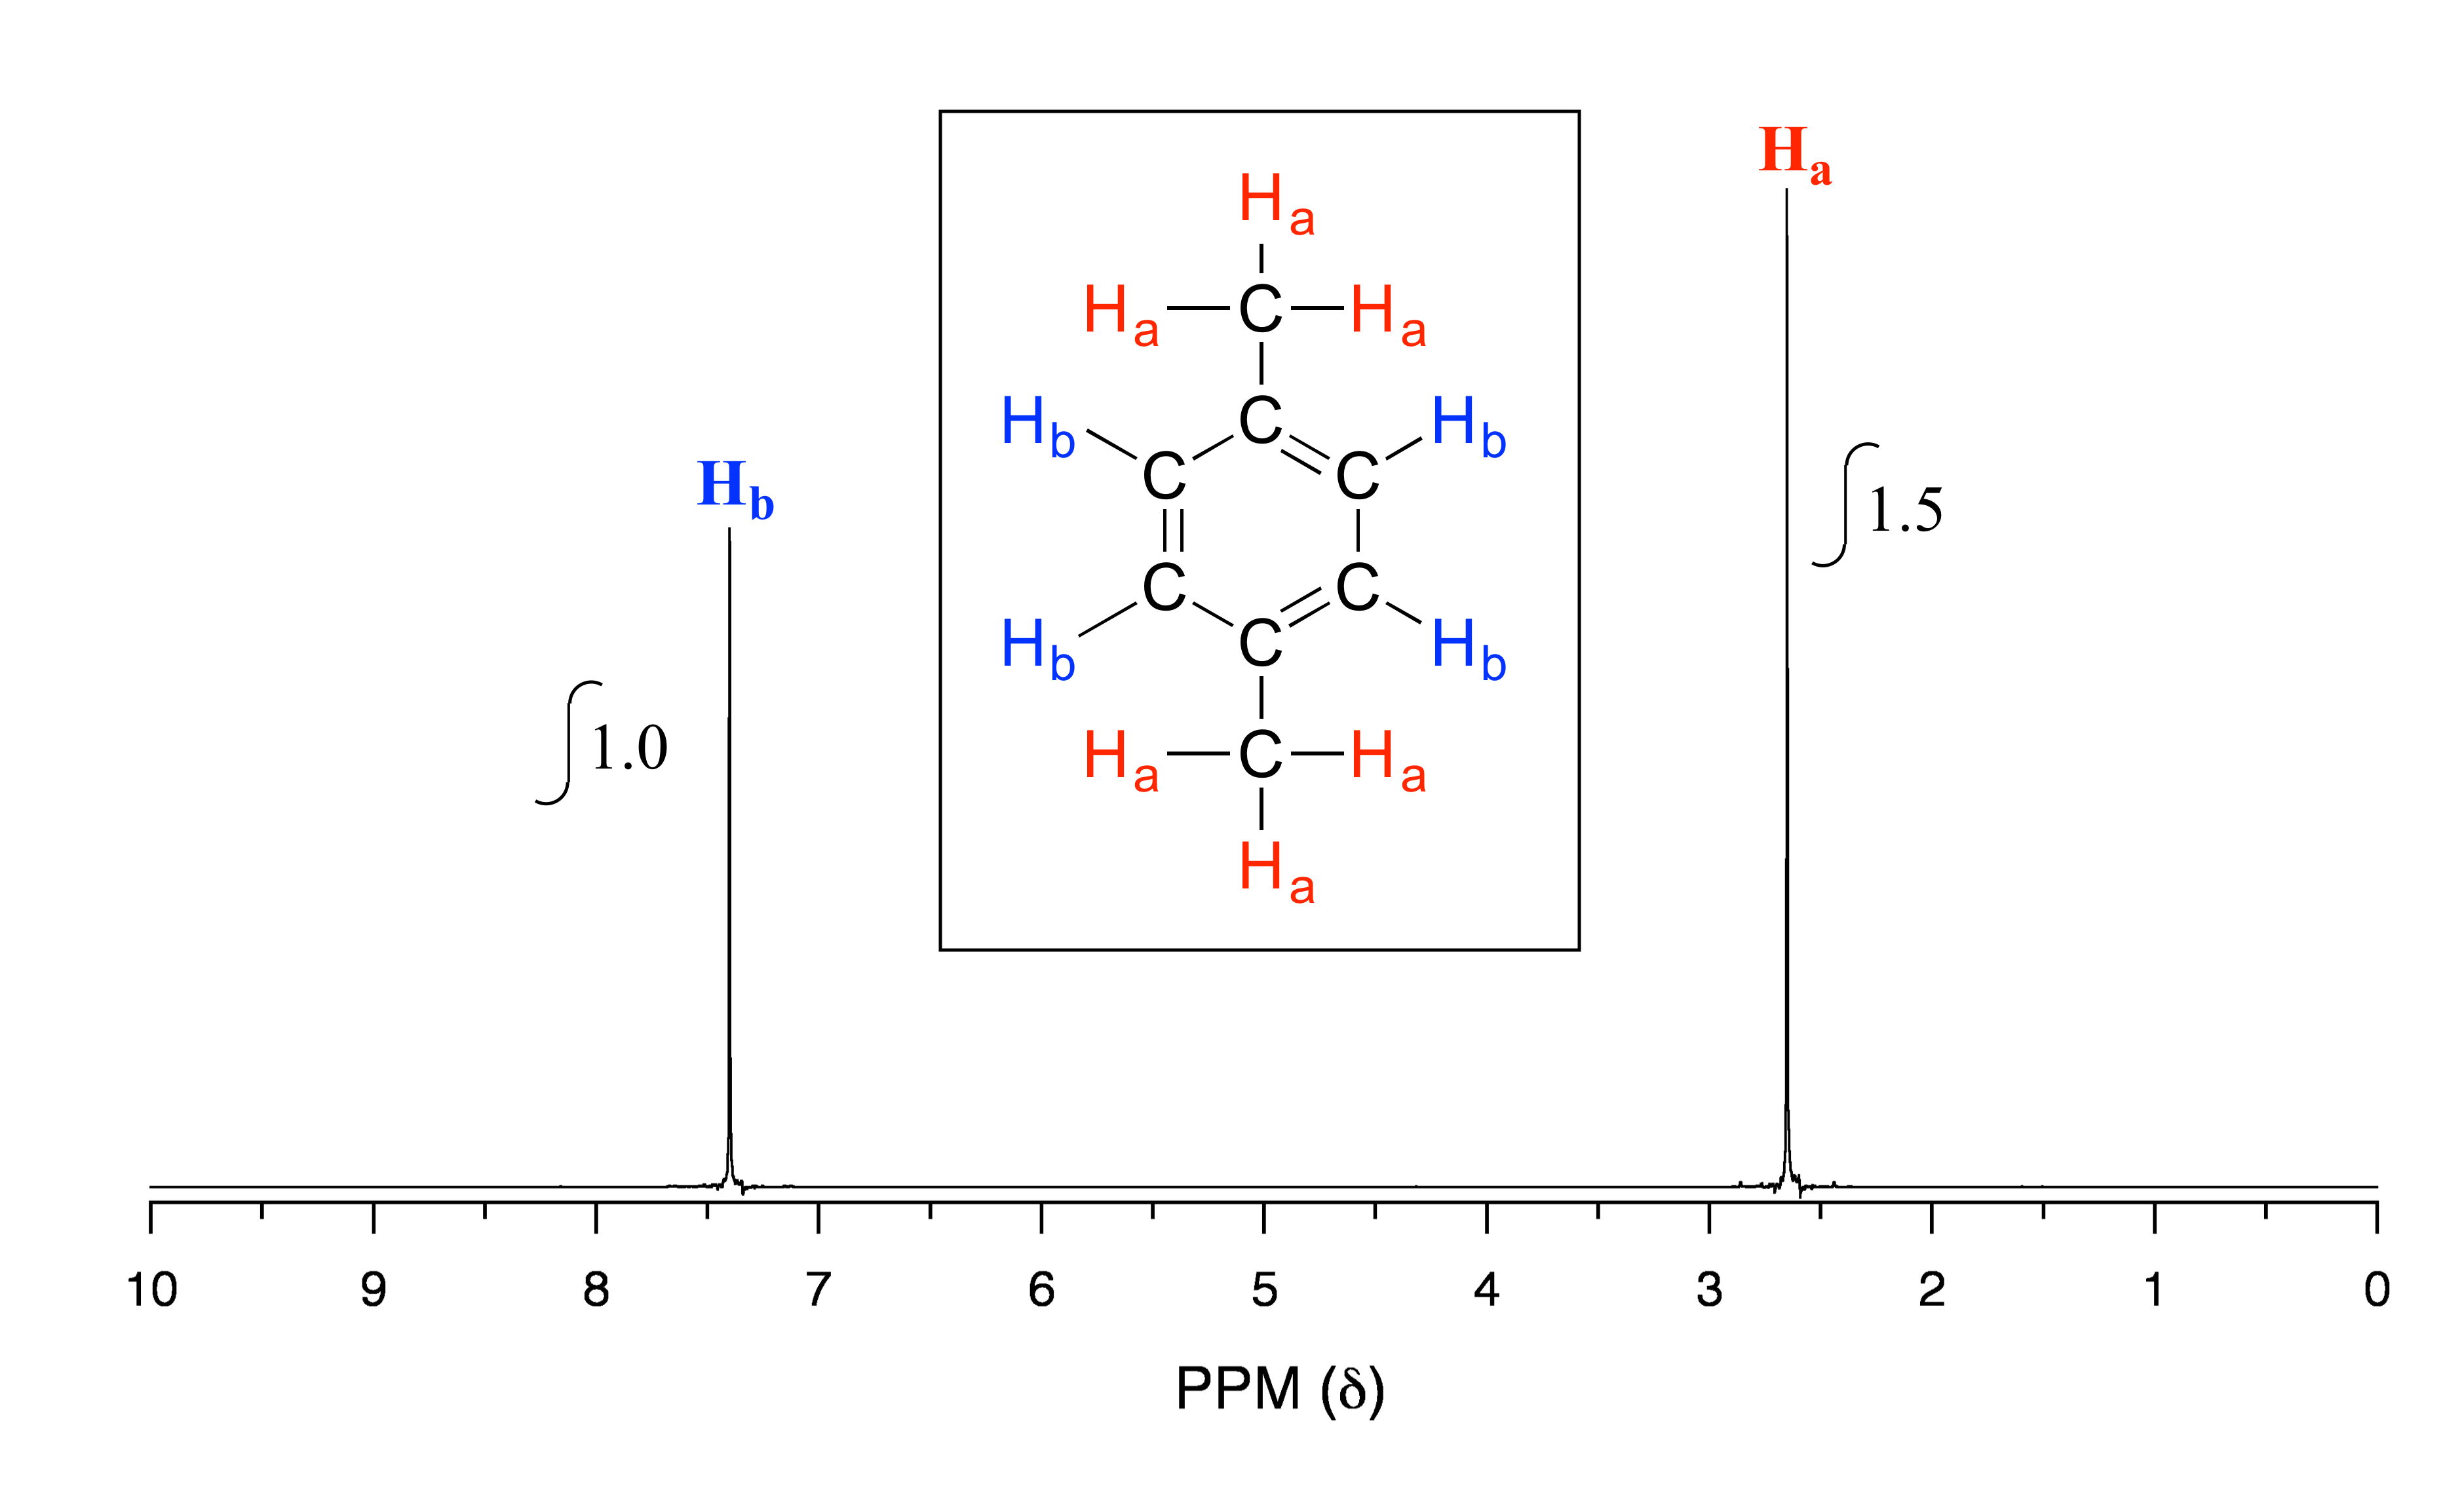
fig 10
As we discussed earlier, this molecule has two sets of equivalent protons: the six methyl (Ha) protons and the four aromatic (Hb) protons. When we instruct the instrument to integrate the areas under the two signals, we find that the area under the peak at 2.6 ppm is 1.5 times greater than the area under the peak at 7.4 ppm. The ratio 1.5 to 1 is of course the same as the ratio 6 to 4. This integration information (along with the actual chemical shift values, which we’ll discuss soon) tells us that the peak at 7.4 ppm must correspond to Hb, and the peak at 2.6 ppm to Ha.
The integration function can also be used to determine the relative amounts of two or more compounds in a mixed sample. If we take a 1H-NMR spectrum of a sample that is a equimolar mixture of benzene and acetone, for example, we will see two signals, one for the six equivalent acetone protons and one for the six equivalent benzene protons. The integrated area under the acetone signal will be the same as the area under the benzene sample, because both signals represent six protons. If we have an equimolar mixture of acetone and cyclopentane, on the other hand, the ratio of the acetone peak area to the cylopentane peak area will be 3:5 (or 6:10), because the cyclopentane signal represents ten protons.
Exercise 5.4: You take a 1H-NMR spectrum of a mixed sample of acetone and dichloromethane. The integral ratio of the two signals (acetone to dichloromethane) is 2.3 to 1. What is the molar ratio of the two compounds in the sample?
Exercise 5.5: You take the 1H-NMR spectrum of a mixed sample of 36% 1,4-dimethylbenzene and 64% acetone (these are mole percentages). What is the expected integration ratio of the signals that you would observe? Order the ratio from highest to lowest numbers.
5.4: The basis for differences in chemical shift#
5.4A: Diamagnetic shielding and deshielding#
We come now to the question of why nonequivalent protons have different resonance frequencies and thus different chemical shifts. The chemical shift of a given proton is determined primarily by interactions with the nearby electrons. The most important thing to understand is that when electrons are subjected to an external magnetic field, they form their own small induced magnetic fields in opposition to the external field.
Consider the methane molecule (CH4) in which the four equivalent protons have a chemical shift of 0.23 ppm (this is a value we can look up in any chemistry reference source). The valence electrons around the methyl carbon, when subjected to B0, generate their own very small induced magnetic field that opposes B0. This induced field, to a small but significant degree, shields the nearby protons from experiencing the full force of B0, an effect known as local diamagnetic shielding. In other words, the methane protons do not quite experience the full force of B0 - what they experience is called Beff, or the effective field, which is slightly weaker than B0 due to the influence of the nearby electrons.
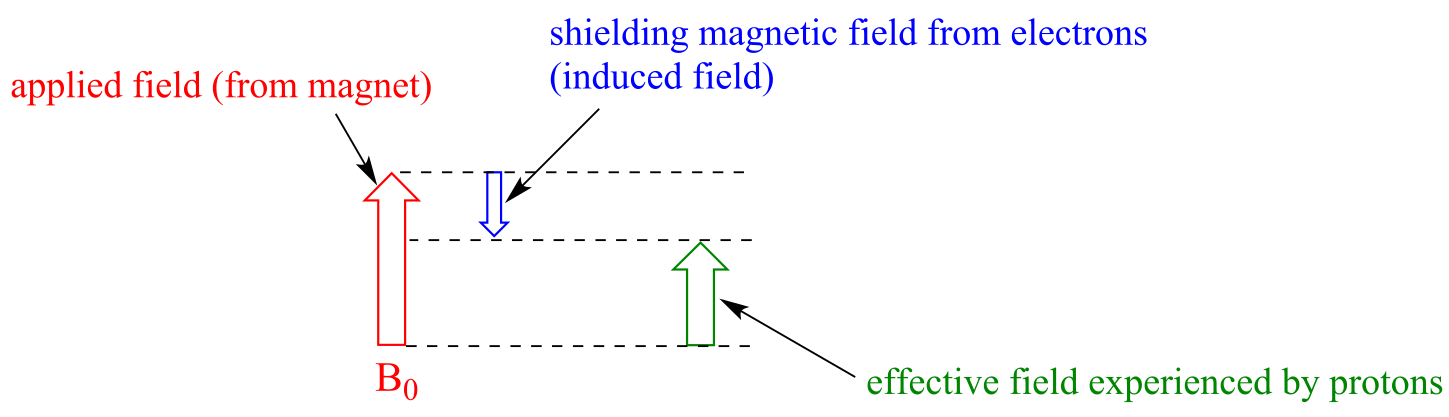
fig 11
Because Beff is slightly weaker than B0, the resonance frequency (and thus the chemical shift) of the methane proton is slightly lower than what it would be if it did not have electrons nearby and was feeling the full force of B0. (You should note that the figure above is not to scale: the applied field is generated by a superconducting magnet and is extremely strong, while the opposing induced field from the electrons is comparatively very small.)
Now consider methyl fluoride, CH3F, in which the protons have a chemical shift of 4.26 ppm, significantly higher than that of methane. This is caused by something called the deshielding effect. Recall that fluorine is very electronegative: it pulls electrons towards itself, effectively decreasing the electron density around each of the protons. For the protons, being in a lower electron density environment means less diamagnetic shielding, which in turn means a greater overall exposure to B0, a stronger Beff, and a higher resonance frequency. Put another way, the fluorine, by pulling electron density away from the protons, is deshielding them, leaving them more exposed to B0. As the electronegativity of the substituent increases, so does the extent of deshielding, and so does the chemical shift. This is evident when we look at the chemical shifts of methane and three halomethane compounds (remember that electronegativity increases as we move up a column in the periodic table, so flourine is the most electronegative and bromine the least).
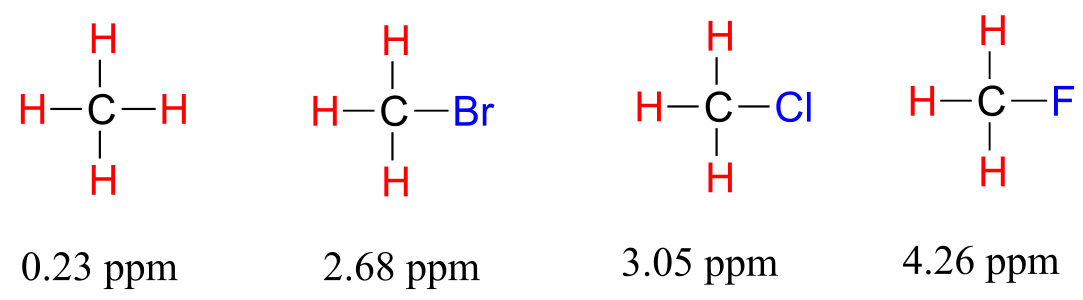
fig 12
To a large extent, then, we can predict trends in chemical shift by considering how much deshielding is taking place near a proton. The chemical shift of trichloromethane (common name chloroform) is, as expected, higher than that of dichloromethane, which is in turn higher than that of chloromethane.
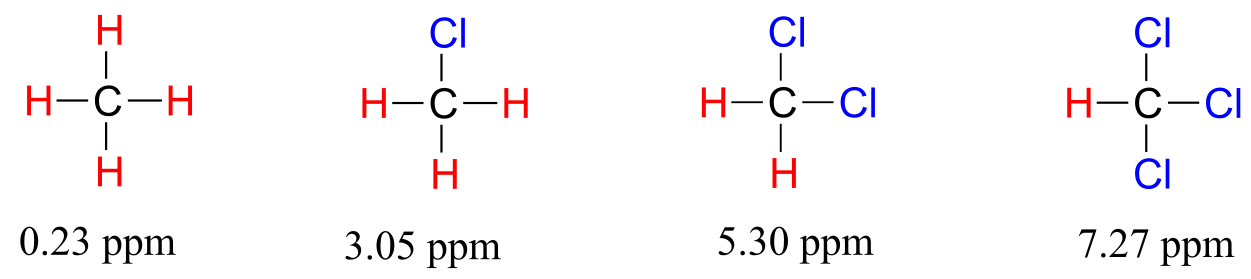
fig 13
The deshielding effect of an electronegative substituent diminishes sharply with increasing distance:
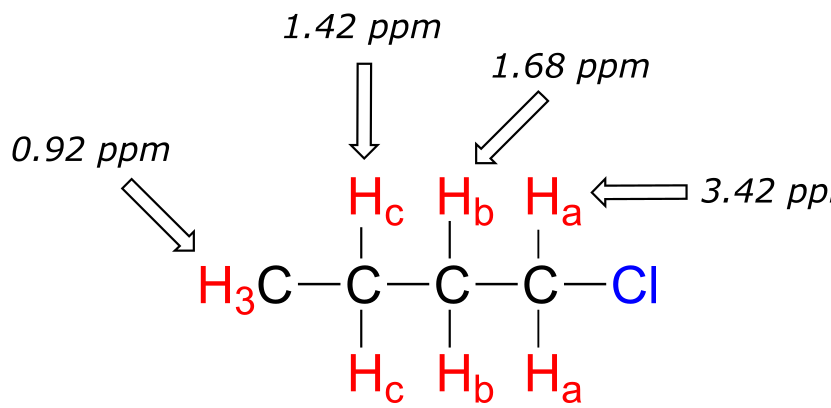
fig 14
The presence of an electronegative oxygen, nitrogen, sulfur, or sp2-hybridized carbon also tends to shift the NMR signals of nearby protons slightly downfield:
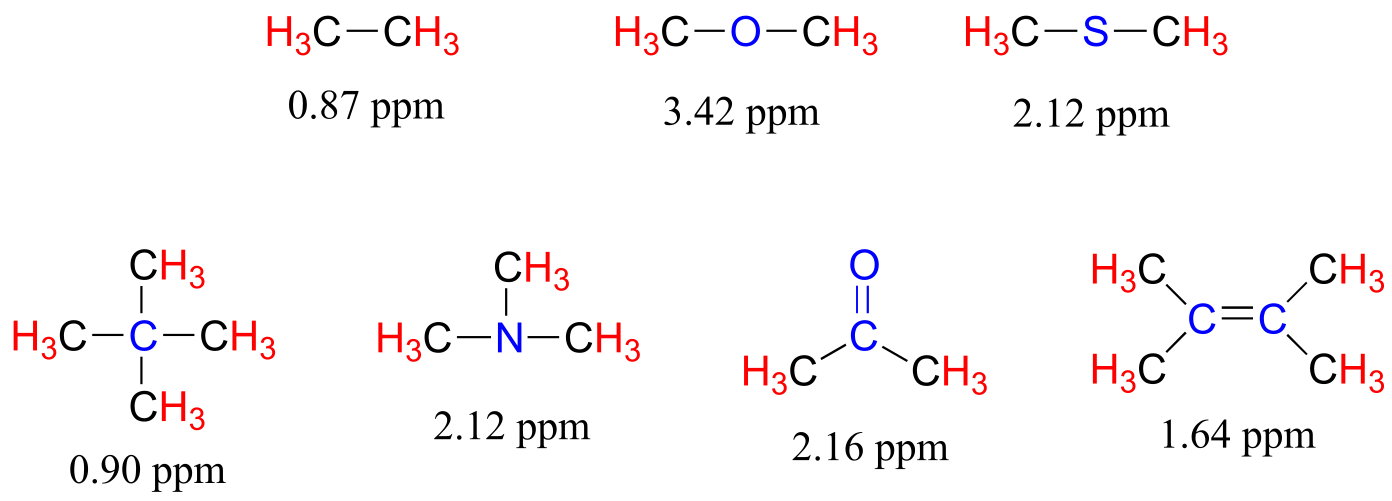
fig 15
Now we can finally assign the two peaks in the the 1H-NMR spectrum of methyl acetate. We can predict that the methyl ester protons (Hb), which are deshielded by the adjacent oxygen atom, will have a higher chemical shift than the acetate protons (Ha), which are deshielded to a lesser extent by the carbonyl group. Therefore, the signal at 3.7 must correspond to Hb, and the signal at 2.0 to Ha.
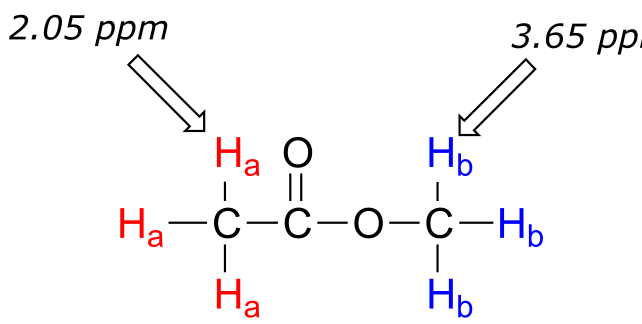
fig 16
5.4B: Diamagnetic anisotropy#
Vinylic protons (those directly bonded to an alkene carbon) and aromatic protons resonate much further downfield than can be accounted for simply by the deshielding effect of nearby electronegative atoms. Note the chemical shifts of the vinylic and aromatic protons in cyclohexene and benzene:
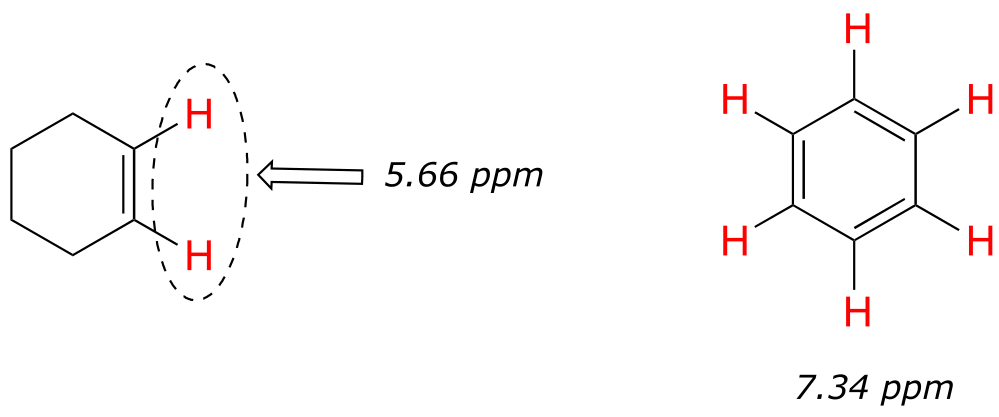
fig 17
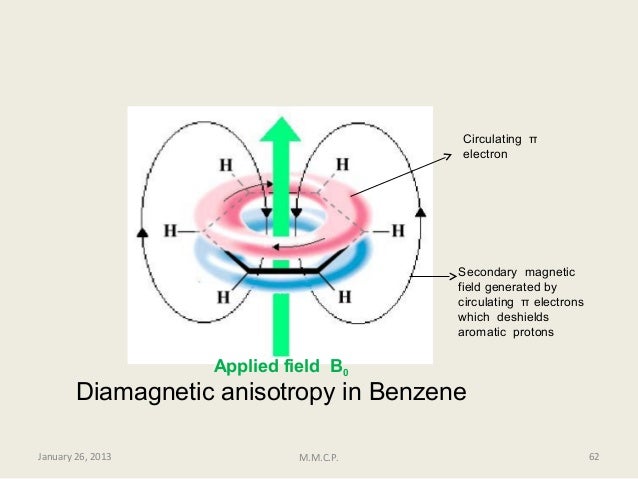
We’ll consider the aromatic proton first. Recall that in benzene and many other aromatic structures, a sextet of π electrons is delocalized around the ring. When the molecule is exposed to B0, these π electrons begin to circulate in a ring current, generating their own induced magnetic field that opposes B0. In this case, however, the induced field of the π electrons does not shield the aromatic protons from B0 as you might expect– rather, it causes the protons to experience a stronger magnetic field in the direction of B0 – in other words, it adds to B0 rather than subtracting from it.
To understand how this happens, we need to understand the concept of diamagnetic anisotropy (anisotropy means `non-uniformity`). So far, we have been picturing magnetic fields as being oriented in a uniform direction. This is only true over a small area. If we step back and take a wider view, however, we see that the lines of force in a magnetic field are actually anisotropic. They start in the ‘north’ direction, then loop around like a snake biting its own tail.
fig 18
If we are at point A in the figure above, we feel a magnetic field pointing in a northerly direction. If we are at point B, however, we feel a field pointing to the south.
In the induced field generated by the aromatic ring current, the aromatic protons are at the equivalent of ‘point B’ – this means that the induced current in this region of space is oriented in the same direction as B0, so it adds to B0 rather than subtracting from it.
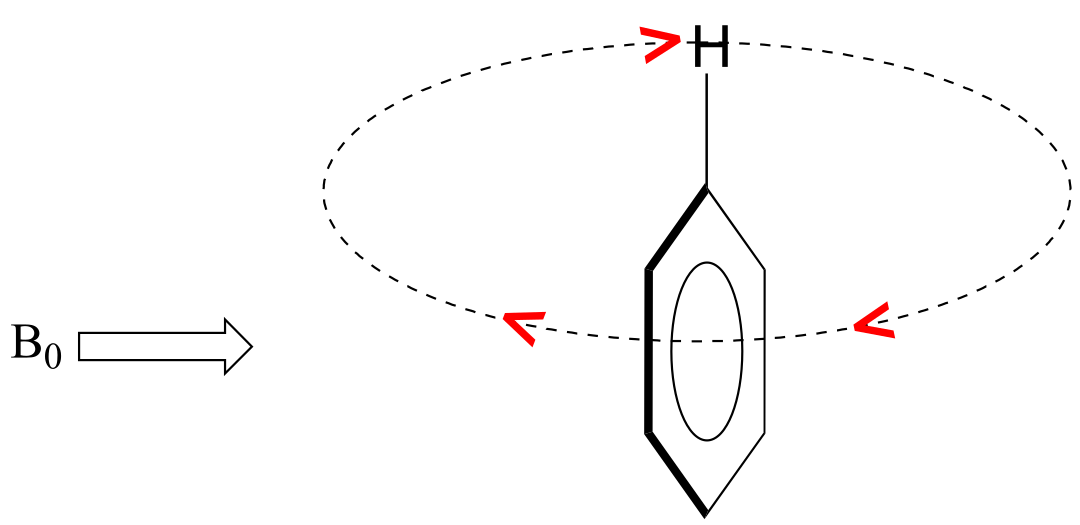
fig 19
The end result is that aromatic protons, due to the anisotropy of the induced field generated by the π ring current, appear to be highly deshielded. Their chemical shift is far downfield, in the 6.5-8 ppm region.
Diamagnetic anisotropy is also responsible for the downfield chemical shifts of vinylic protons (4.5-6.5 ppm) and aldehyde protons (9-10 ppm). These groups are not aromatic and thus do not generate ring currents does benzene, but the π electrons circulate in such a way as to generate a magnetic field that adds to B0 in the regions of space occupied by the protons. Carboxylic acid protons are very far downfield (10-12 ppm) due to the combined influence of the electronegative oxygen atom and the nearby π bond.
5.4C: Hydrogen bonded protons#
Protons that are directly bonded to oxygen or nitrogen have chemical shifts that can vary widely depending on solvent and concentration. These protons can participate to varying degrees in hydrogen bonding interactions, and the degree hydrogen bonding greatly influences the electron density around the proton - and thus the chemical shift. Signals for hydrogen bonding protons also tend to be broader than those of hydrogens bonded to carbon, a phenomenon that is also due to hydrogen bonding.
Alcohol protons, for example, will usually show broad signals anywhere between 1-5 ppm. The signal for Ha in the spectrum of 1-heptanol is a typical example of a broadened NMR signal for an alcohol proton.

fig 19a
The table below provides a summary of approximate chemical shift ranges for protons in different bonding arrangements. A more detailed table can be found in the appendix.
Typical chemical shift ranges in 1H-NMR
type of proton |
chemical shift range (ppm) |
|---|---|
bonded to sp3 carbon |
0.5 - 4 |
bonded to N (amine) |
1 - 3 |
bonded to O (alcohol) |
1 - 5 |
alkene/ vinylic |
3.5 - 6.5 |
terminal alkyne |
2 - 3 |
bonded to N (amide) |
5 - 9 |
aromatic |
6 - 9 |
aldehyde |
9.5 - 10 |
carboxylic acid |
10 - 13 |
Exercise 5.6: For each pair of protons colored red (Ha) and blue (Hb) in the structures below, state which is expected to have the higher chemical shift in 1H-NMR. For some of these it will be helpful to consult Table 2 at the back of the book.
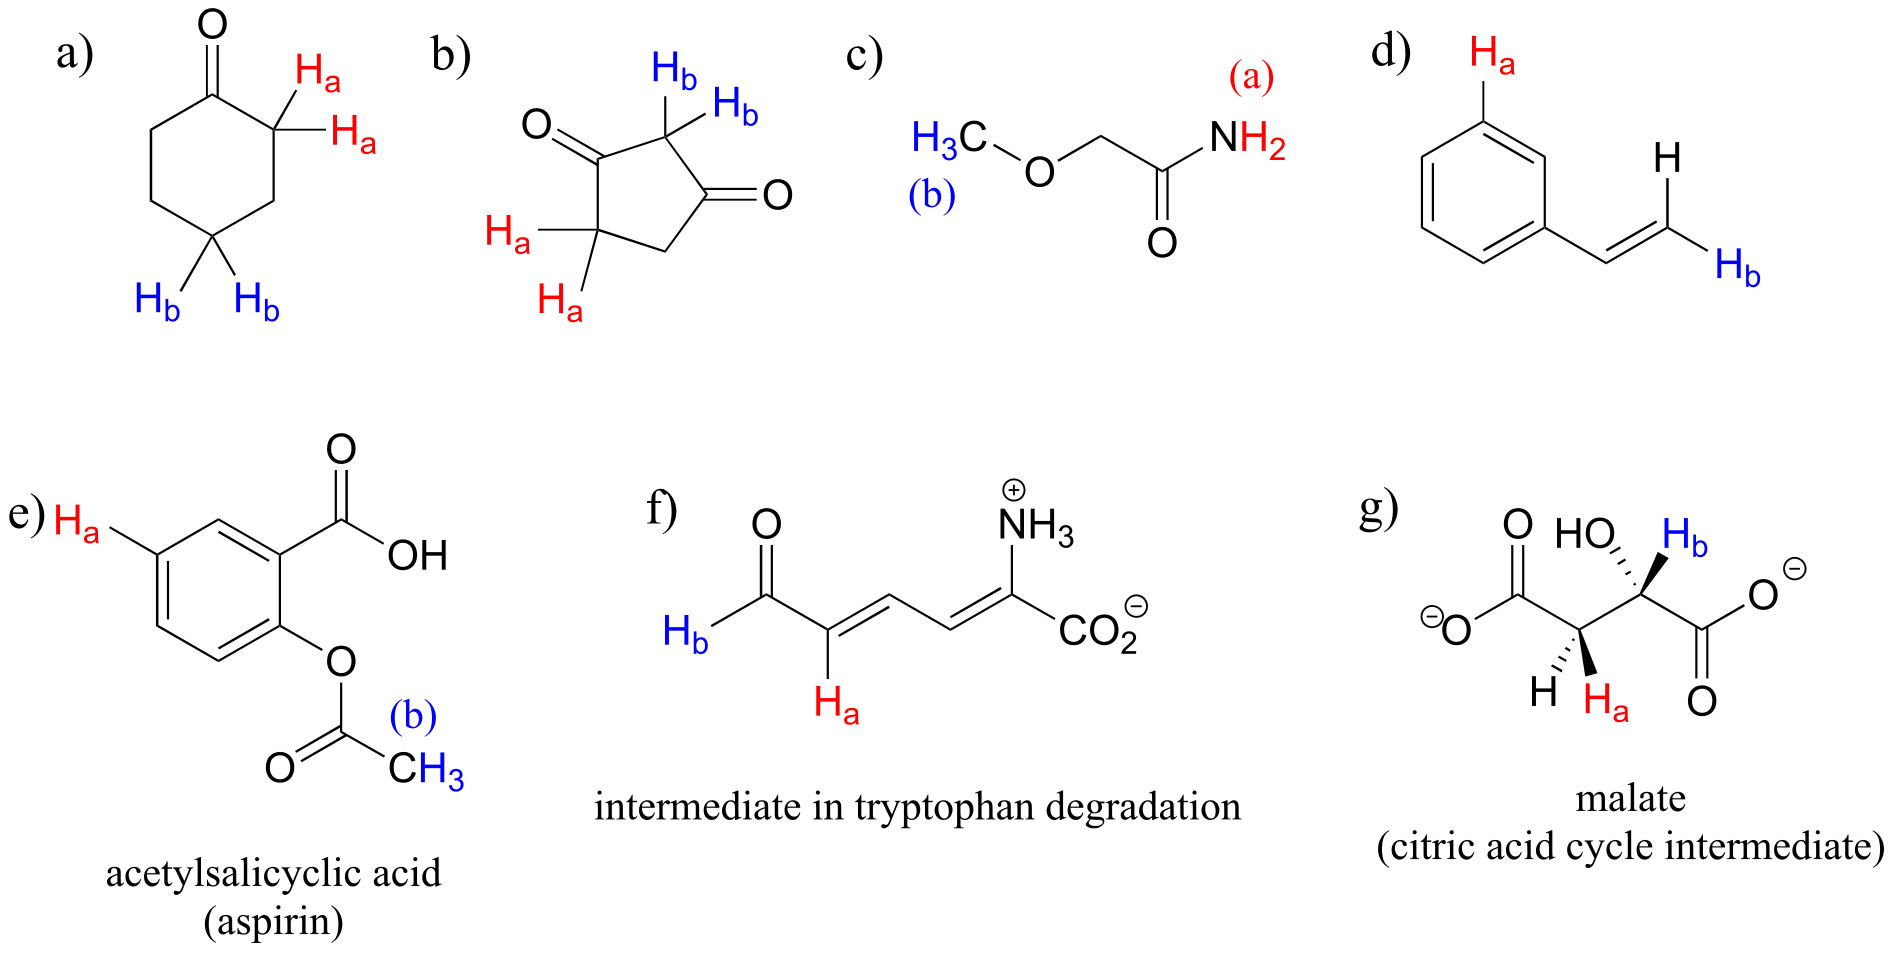
fig 16a
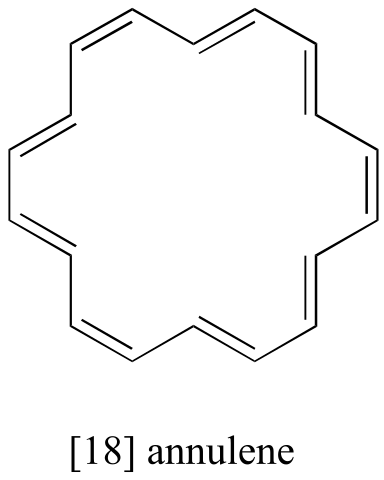
Exercise 5.7: The 1H-NMR spectrum of the aromatic compound [18] annulene has two peaks, at 8.9 ppm and -1.8 ppm (a negative chemical shift, upfield of TMS!) with an integration ratio of 2:1. Explain the unusual chemical shift of the latter peak.
5.5: Spin-spin coupling#
The 1H-NMR spectra that we have seen so far (of methyl acetate and 1,4-dimethylbenzene) are somewhat unusual in the sense that in both of these molecules, each set of protons generates a single NMR signal. In fact, the 1H-NMR spectra of most organic molecules contain proton signals that are ‘split’ into two or more sub-peaks. Rather than being a complication, however, this splitting behavior is actually very useful because it provides us with more information about our sample molecule.
Consider the spectrum for 1,1,2-trichloroethane. In this and in many spectra to follow, we show enlargements of individual signals so that the signal splitting patterns are recognizable.
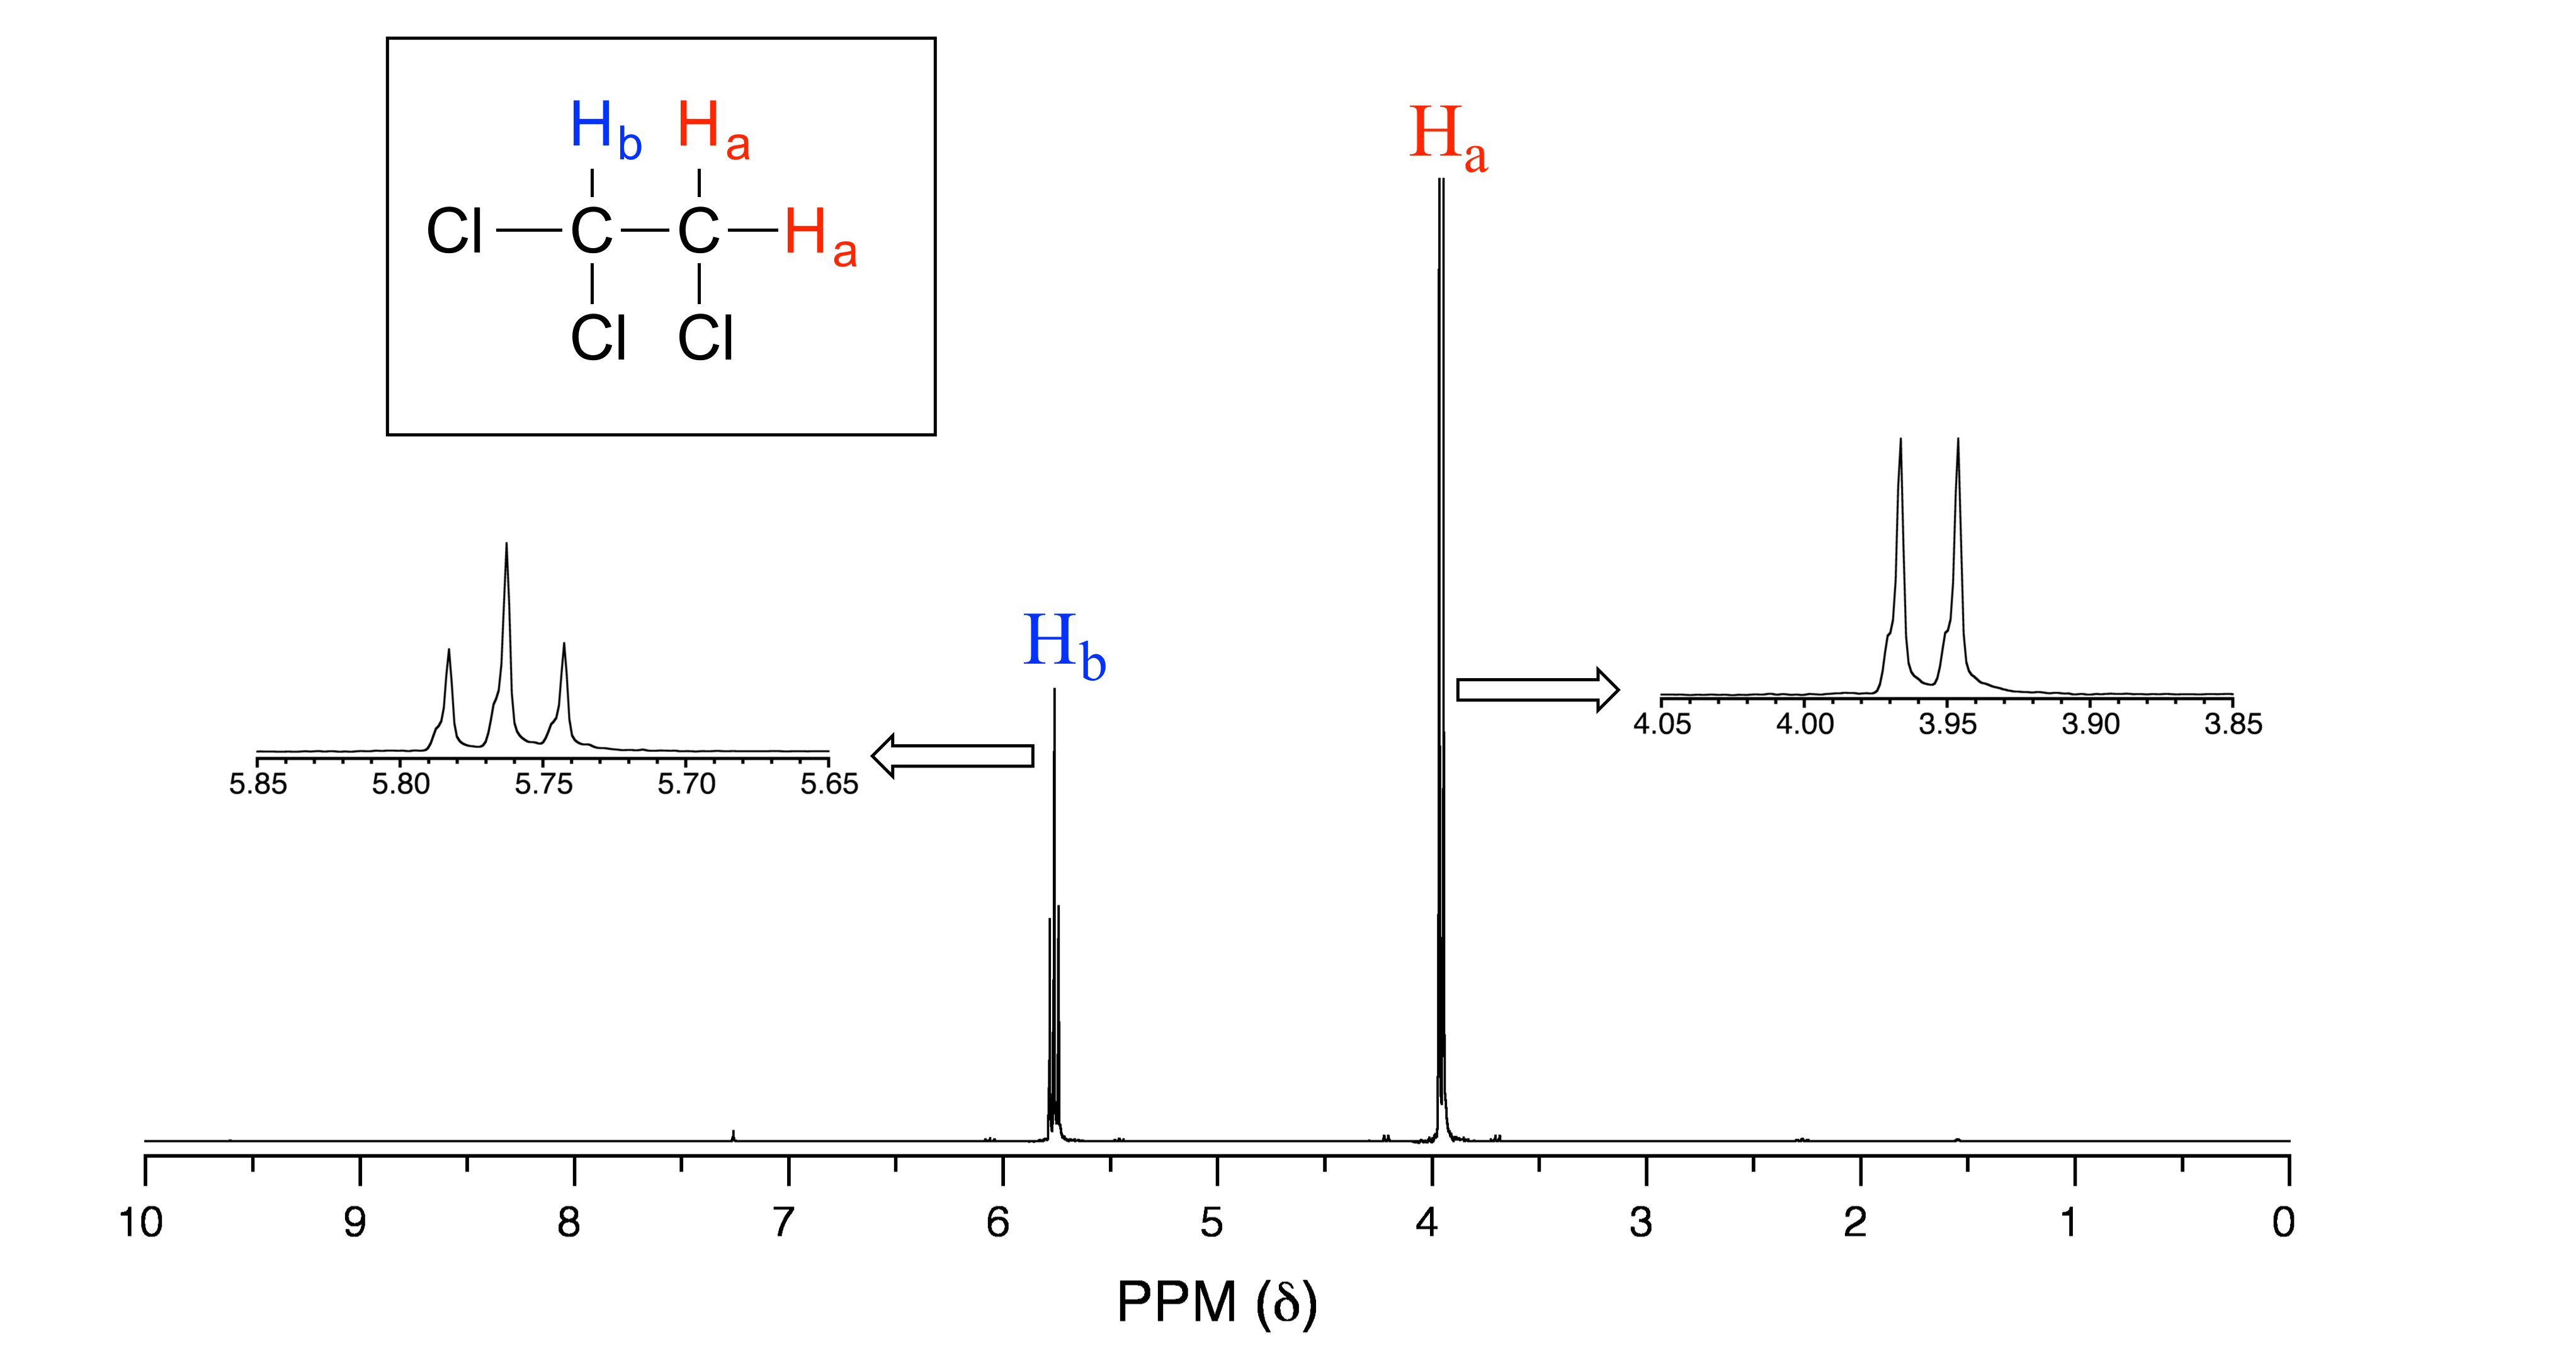
fig 20
The signal at 3.96 ppm, corresponding to the two Ha protons, is split into two subpeaks of equal height (and area) – this is referred to as a doublet. The Hb signal at 5.76 ppm, on the other hand, is split into three sub-peaks, with the middle peak higher than the two outside peaks - if we were to integrate each subpeak, we would see that the area under the middle peak is twice that of each of the outside peaks. This is called a triplet.
The source of signal splitting is a phenomenon called spin-spin coupling, a term that describes the magnetic interactions between neighboring, non-equivalent NMR-active nuclei. (The terms ‘splitting’ and ‘coupling’ are often used interchangeably when discussing NMR.) In our 1,1,2 trichloromethane example, the Ha and Hb protons are spin-coupled to each other. Here’s how it works, looking first at the Ha signal: in addition to being shielded by nearby valence electrons, each of the Ha protons is also influenced by the small magnetic field generated by Hb next door (remember, each spinning proton is like a tiny magnet). The magnetic moment of Hb will be aligned with B0 in slightly more than half of the molecules in the sample, while in the remaining molecules it will be opposed to B0. The Beff ‘felt’ by Ha is a slightly weaker if Hb is aligned against B0, or slightly stronger if Hb is aligned with B0. In other words, in half of the molecules Ha is shielded by Hb (thus the NMR signal is shifted slightly upfield) and in the other half Ha is deshielded by Hb (and the NMR signal shifted slightly downfield). What would otherwise be a single Ha peak has been split into two sub-peaks (a doublet), one upfield and one downfield of the original signal. These ideas an be illustrated by a splitting diagram, as shown below.
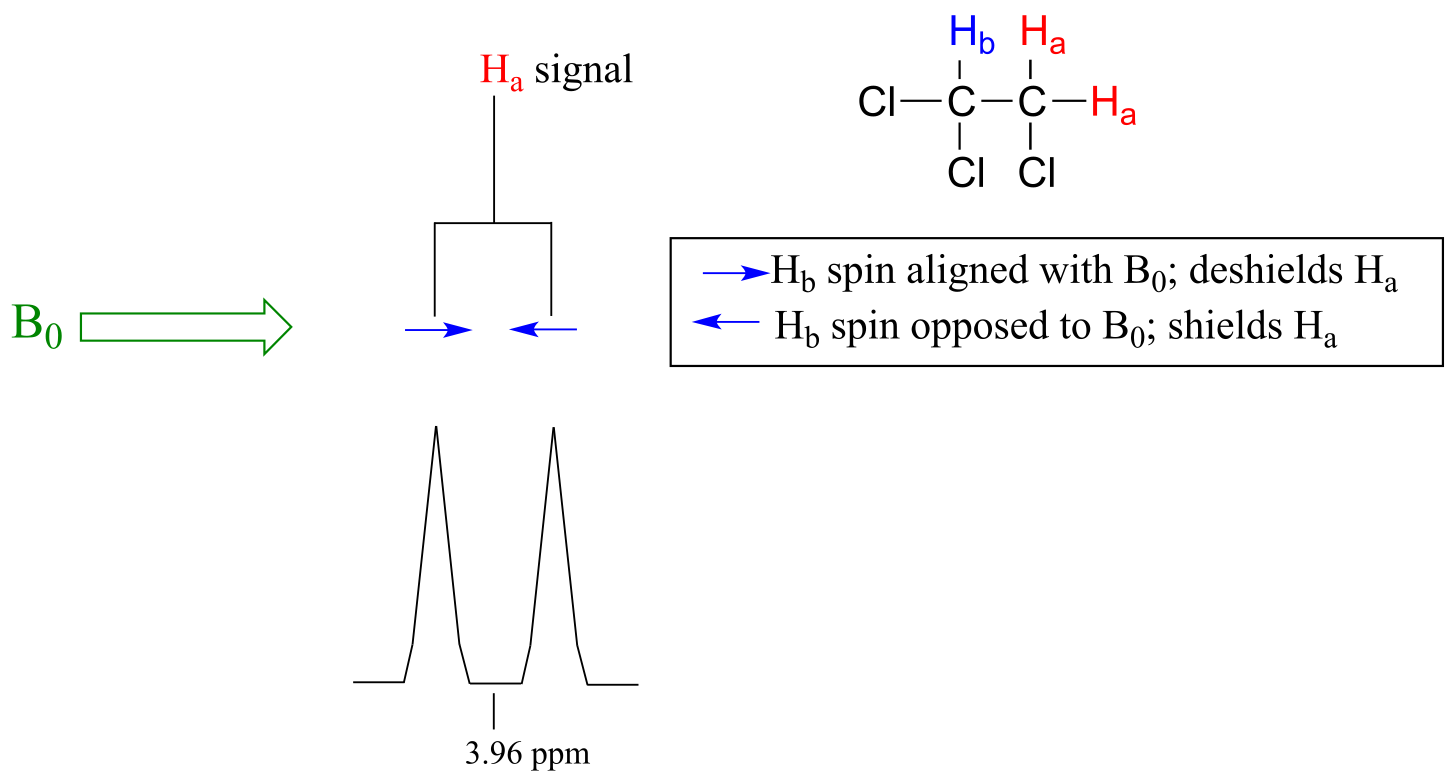
fig 21
Now, let’s think about the Hb signal. The magnetic environment experienced by Hb is influenced by the fields of both neighboring Ha protons, which we will call Ha1 and Ha2. There are four possibilities here, each of which is equally probable. First, the magnetic fields of both Ha1 and Ha2 could be aligned with B0, which would deshield Hb, shifting its NMR signal slightly downfield. Second, both the Ha1 and Ha2 magnetic fields could be aligned opposed to B0, which would shield Hb, shifting its resonance signal slightly upfield. Third and fourth, Ha1 could be with B0 and Ha2 opposed, or Ha1 opposed to B0 and Ha2 with B0. In each of the last two cases, the shielding effect of one Ha proton would cancel the deshielding effect of the other, and the chemical shift of Hb would be unchanged.
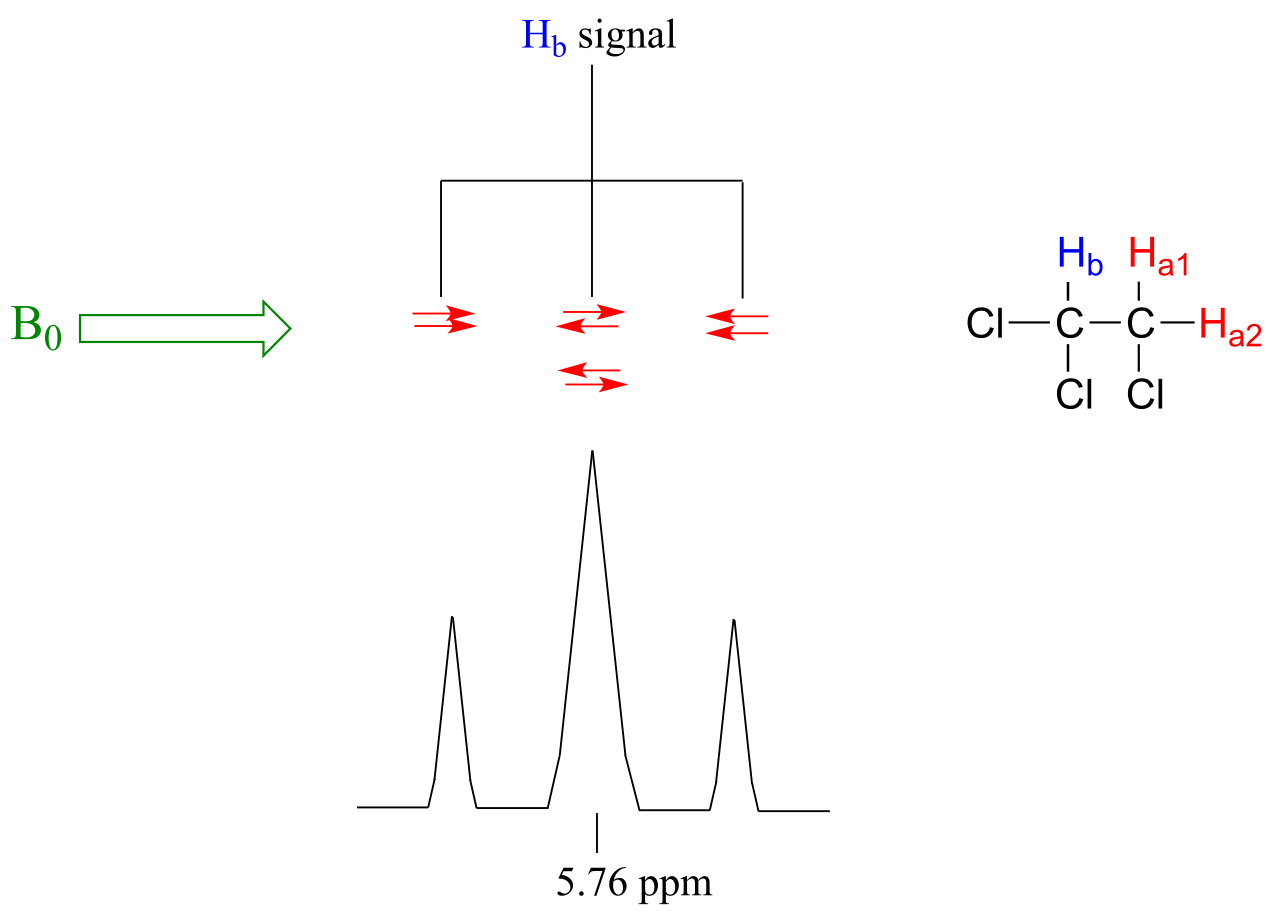
fig 22
So in the end, the signal for Hb is a triplet, with the middle peak twice as large as the two outer peaks because there are two ways that Ha1 and Ha2 can cancel each other out.
Consider the spectrum for ethyl acetate:
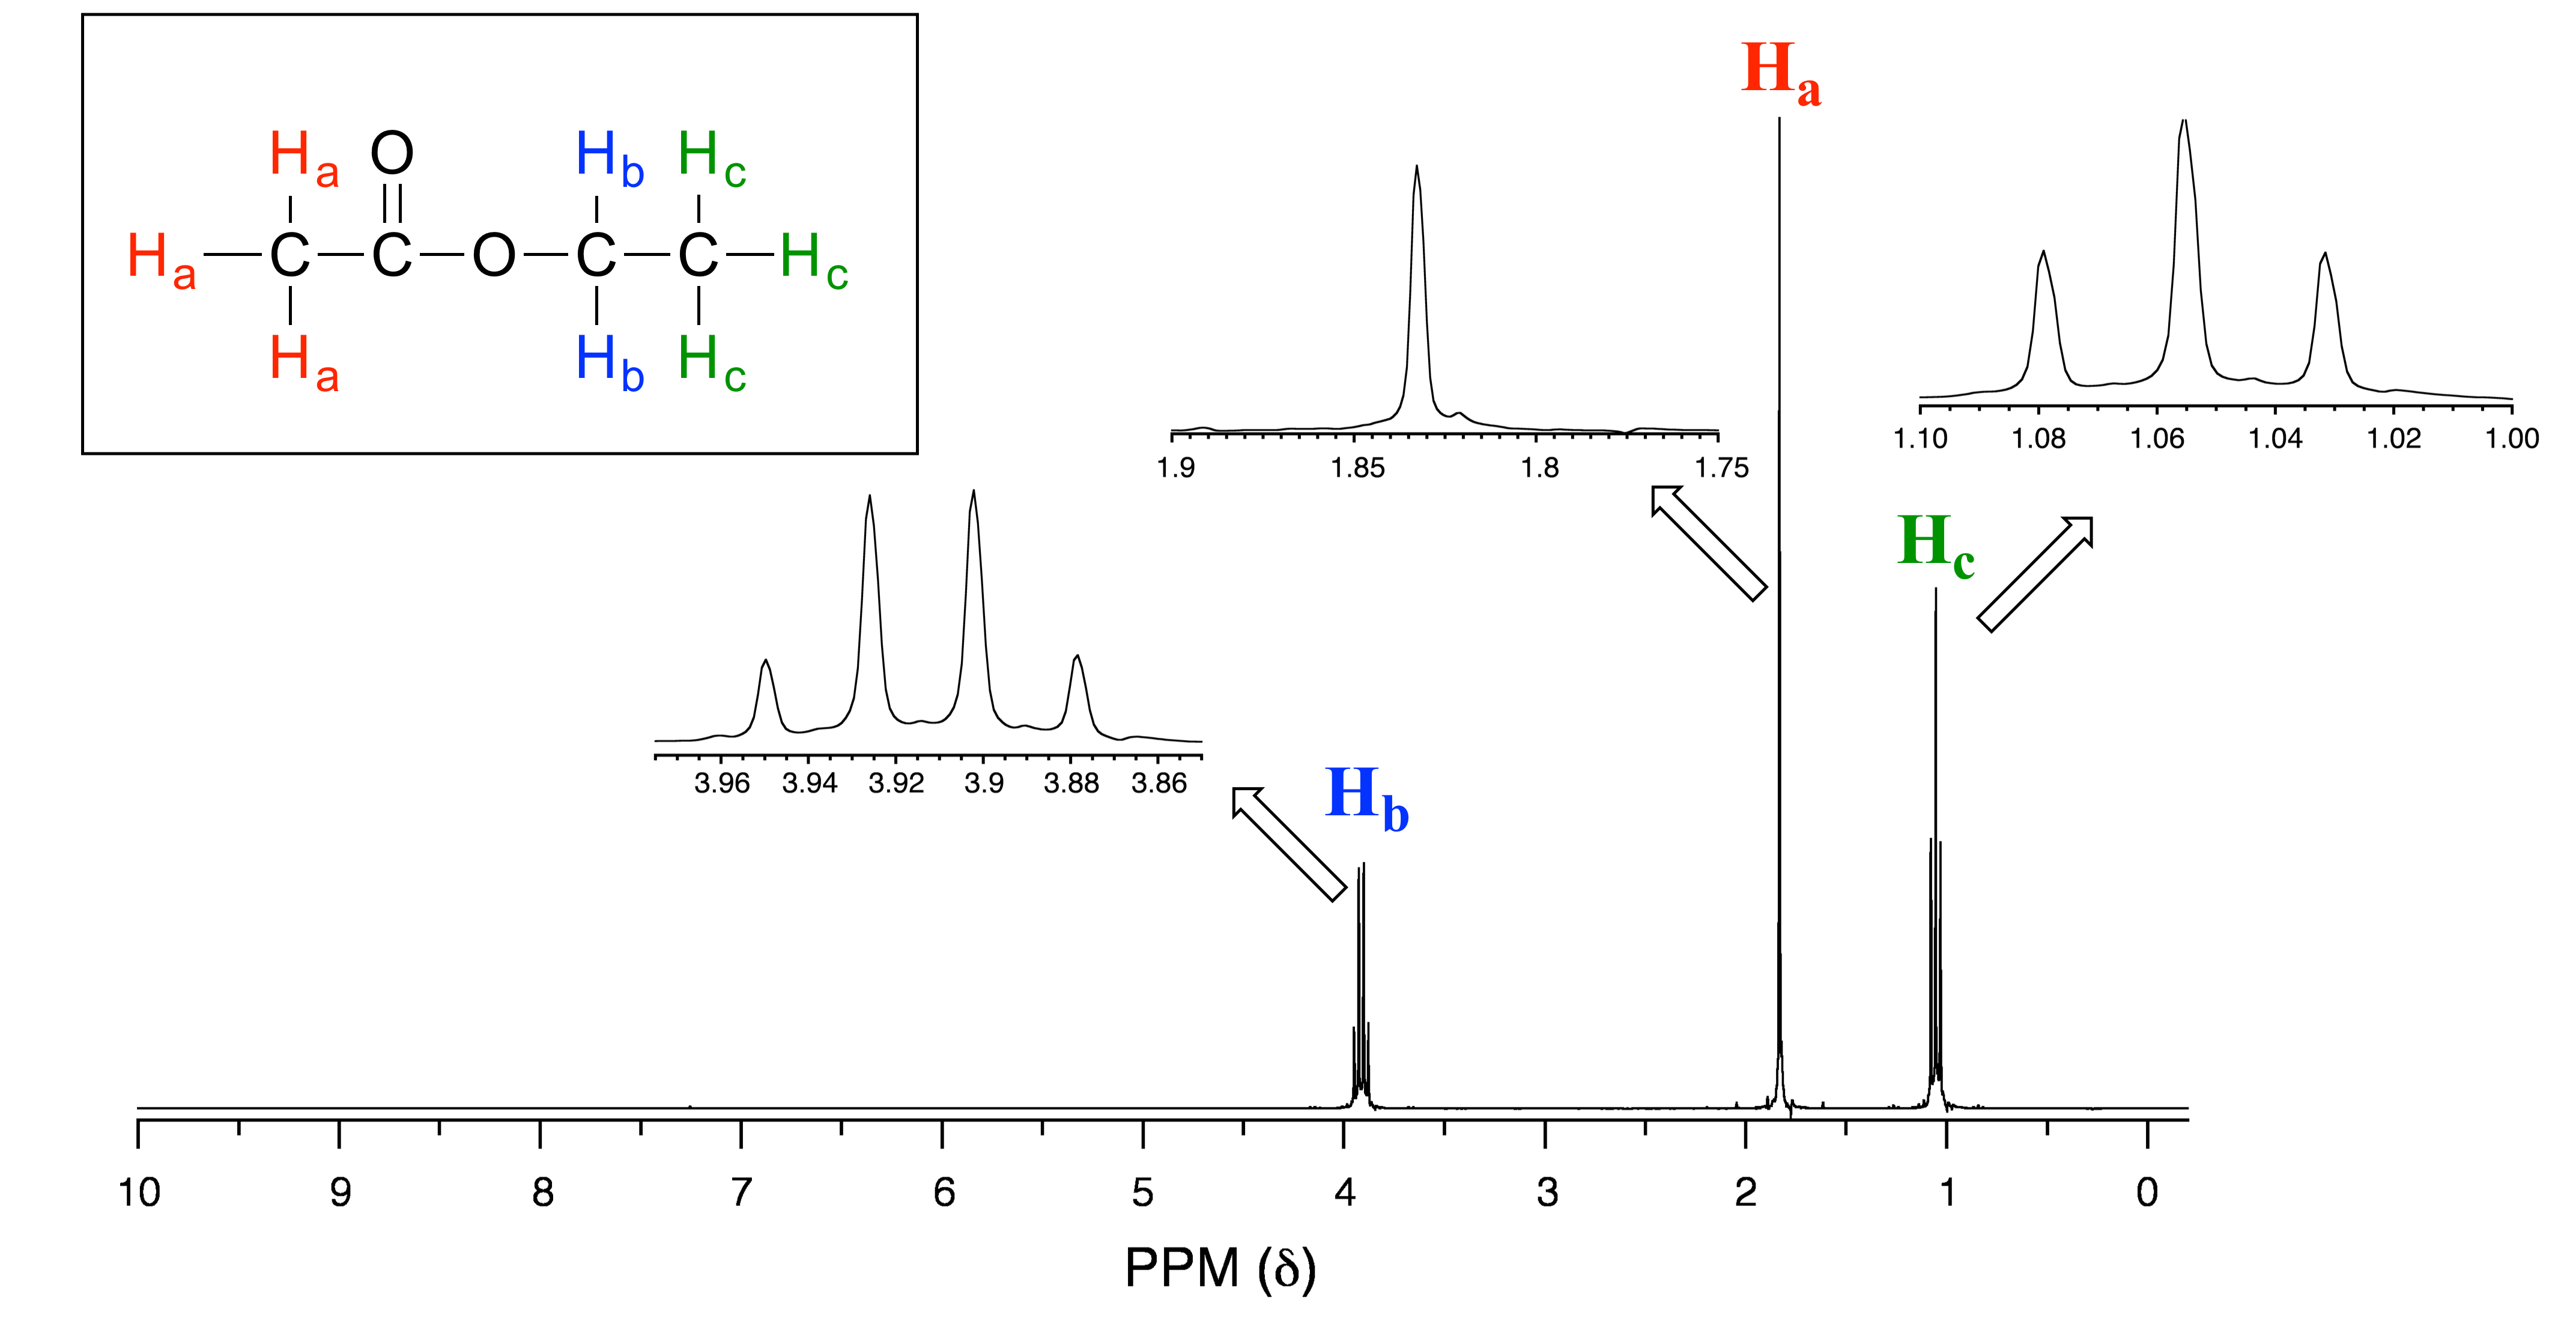
fig 23
We see an unsplit ‘singlet’ peak at 1.83 ppm that corresponds to the acetyl (Ha) protons – this is similar to the signal for the acetate protons in methyl acetate that we considered earlier. This signal is unsplit because there are no adjacent protons on the molecule. The signal at 1.06 ppm for the Hc protons is split into a triplet by the two Hb protons next door. The explanation here is the same as the explanation for the triplet peak we saw previously for 1,1,2-trichloroethane.
The Hb protons give rise to a quartet signal at 3.92 ppm – notice that the two middle peaks are taller then the two outside peaks. This splitting pattern results from the spin-coupling effect of the three adjacent Hc protons, and can be explained by an analysis similar to that which we used to explain the doublet and triplet patterns.
Exercise 5.8:
a) Explain, using a splitting diagram, the possible combinations of nuclear spin states for the Hc protons in ethyl acetate, and why the Hb signal is split into a quartet.
b) The integration ratio of the two ‘sub-peaks’ in a doublet is 1:1, and in triplets it is 1:2:1. What is the integration ratio of the Hb quartet in ethyl acetate? (Hint – use the illustration that you drew in part a to answer this question.)
By now, you probably have recognized the pattern which is usually referred to as the n + 1 rule: if a set of protons has n neighboring, non-equivalent protons, it will be split into n + 1 subpeaks. Thus the two Hb protons in ethyl acetate split the Hc signal into a triplet, and the three Hc protons split the Hb signal into a quartet. Ha, with zero neighboring protons, is a singlet. This is very useful information if we are trying to determine the structure of an unknown molecule: if we see a triplet signal, we know that the corresponding proton or set of protons has two `neighbors`. When we begin to determine structures of unknown compounds using 1H-NMR spectral data, it will become more apparent how this kind of information can be used.
Four important points need to be emphasized at this point.
First, signal splitting only occurs between non-equivalent protons – in other words, Ha1 in 1,1,2-trichloroethane is not split by Ha2, and vice-versa.
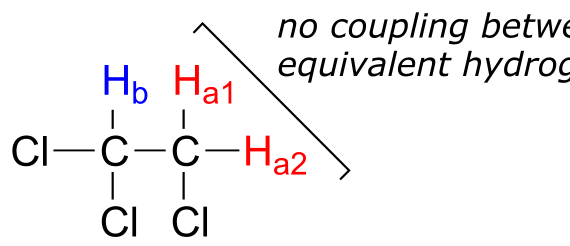
fig 24
Second, splitting occurs primarily between protons that are separated by three or fewer bonds. This is why the Ha protons in ethyl acetate form a singlet– the nearest proton neighbors are five bonds away, too far for coupling to occur.
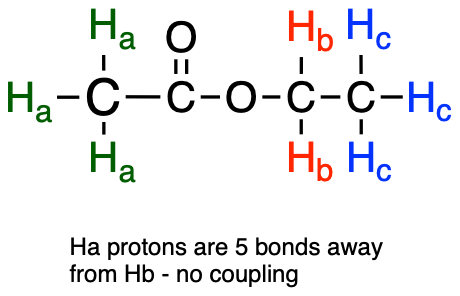
fig 25
With more sensitive instruments we will sometimes see 4-bond and even 5-bond splitting, but in our treatment of NMR, for the sake of simplicity we will always assume that only three-bond splitting is seen.
Third, protons that are bonded to oxygen or nitrogen generally do not split - and are not split by - adjacent protons. OH and NH protons are acidic enough to rapidly exchange between different molecules, so the neighboring protons never actually ‘feels’ their influence.
The spectrum of 1-heptanol has a characteristically broad alcohol proton signal at 3.7 ppm (labeled Ha below).

fig 31
Notice in this spectrum that Hb is a triplet, coupled to the two Hc protons but not coupled to Ha. The signals corresponding to Hc through Hh are complex due to overlapping - when this happens (as it often does!), detailed analysis becomes more challenging.
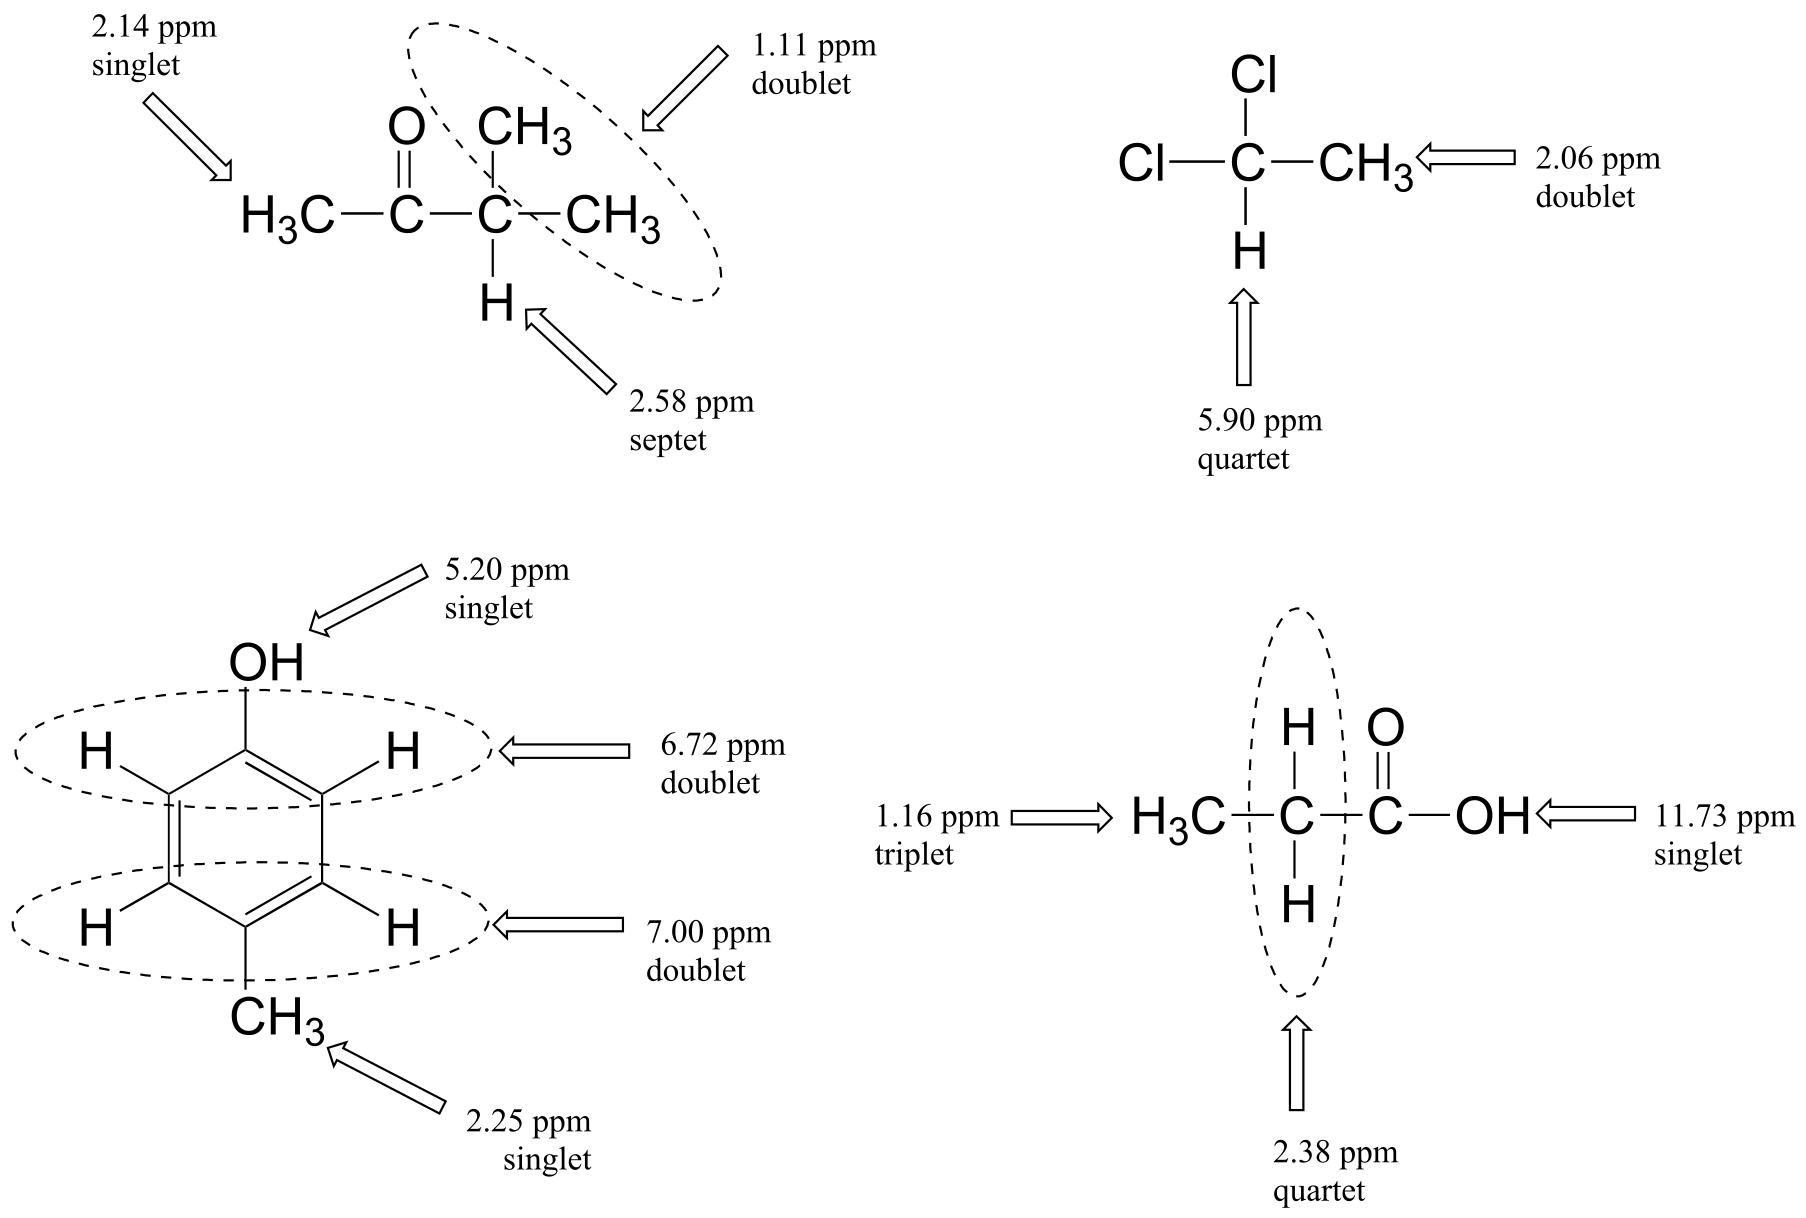
Below are a few more examples of chemical shift and splitting pattern information for some relatively simple organic molecules.
Exercise 5.9: How many proton signals would you expect to see in the 1H-NMR spectrum of triclosan (a common antimicrobial agent in soap)? For each of the proton signals, predict the splitting pattern, assuming that you can see only 3-bond splitting.
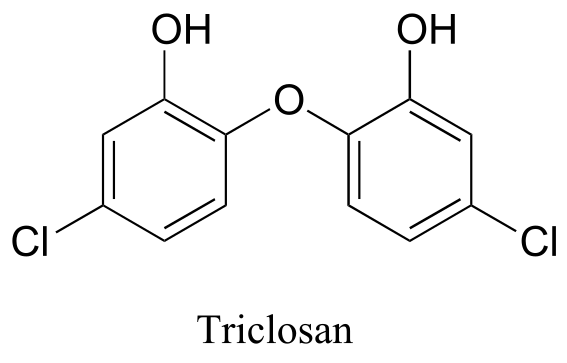
fig 27
Exercise 5.10: How many proton signals would you expect to see in the 1H-NMR spectrum of the neurotransmitter serotonin? For each of the proton signals, predict the splitting pattern, again assuming only 3-bond splitting.
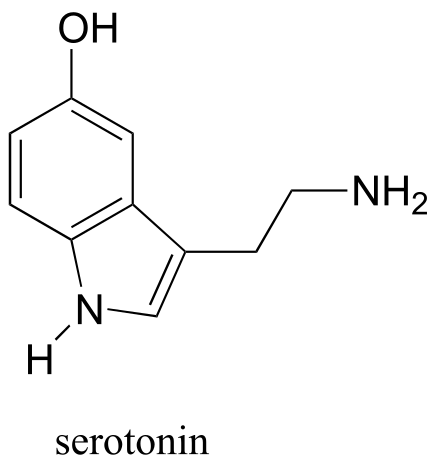
fig 28
In an ideal world, all NMR spectra would be as easy to interpret as those we have seen so far: every peak would be separated from the others, the peak integration would be obvious, and the multiplicity (singlet, doublet, etc.) would be easy to recognize. The real world, unfortunately, is not always so pretty: peaks with similar chemical shifts overlap, making interpretation much more difficult. We have already seen this is the spectrum of 1-heptanol above. In the spectrum of methylbenzene, we would expect the signal for Ha to be a singlet, Hb to be a doublet, and Hc and Hd to be triplets. Looking at relative integration values for the four peaks, we would expect to see a 3:2:2:1 ratio.

fig 29
In practice, however, the three aromatic proton sets Hb, Hc and Hd have very similar chemical shifts so their signals overlap substantially, and we cannot recognize doublet or triplet splitting patterns. In this case, we would refer to the aromatic part of the spectrum as a multiplet. We can report the integration ratio of the Ha peak compared to the combined aromatic peaks as 3 to 5, or the equivalent 1 to 1.67.
The magnitude of spin-spin coupling can be expressed using the coupling constant, abbreviated with the capital letter J. The coupling constant is simply the difference, expressed in Hz, between two adjacent sub-peaks in a split signal, and is a measure of the extent to which one nucleus ‘feels’ the magnetic dipole of its neighbor.
For our doublet in the 1,1,2-trichloroethane spectrum, for example, the two subpeaks are separated by 6.1 Hz, and thus we write 3Ja-b = 6.1 Hz.
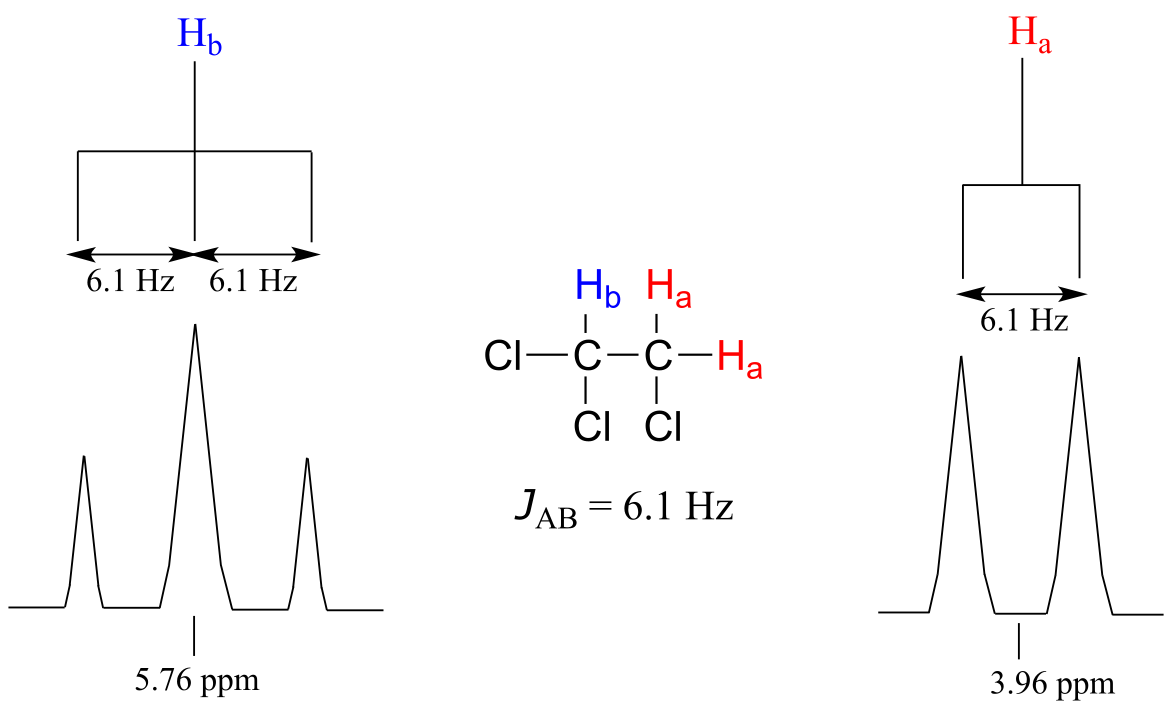
fig 31a
The superscript ‘3’ tells us that this is a three-bond coupling interaction, and the ‘a-b’ subscript tells us that we are talking about coupling between Ha and Hb. Unlike the chemical shift value, the coupling constant, expressed in Hz, is the same regardless of the applied field strength of the NMR magnet. The strength of the magnetic moment of a neighboring proton, which is the source of the spin-spin coupling phenomenon, does not depend on the applied field strength. For this reason, coupling constants are normally given in Hz, not ppm.
When we look closely at the triplet signal in 1,1,2-trichloroethane, we see that the coupling constant - the ‘gap’ between subpeaks - is 6.1 Hz, the same as for the doublet. The coupling constant 3Ja-b quantifies the magnetic interaction between the Ha and Hb hydrogen sets, and this interaction is of the same magnitude in either direction. In other words, spin-spin coupling is reciprocal: Ha influences Hb to the same extent that Hb influences Ha.
Coupling constants between proton sets on neighboring sp3-hybridized carbons is typically in the region of 6-8 Hz. Coupling constants for neighboring vinylic protons can range from 0 Hz (no coupling at all) to 18 Hz, depending on the bonding arrangement.
Typical proton-proton coupling constants
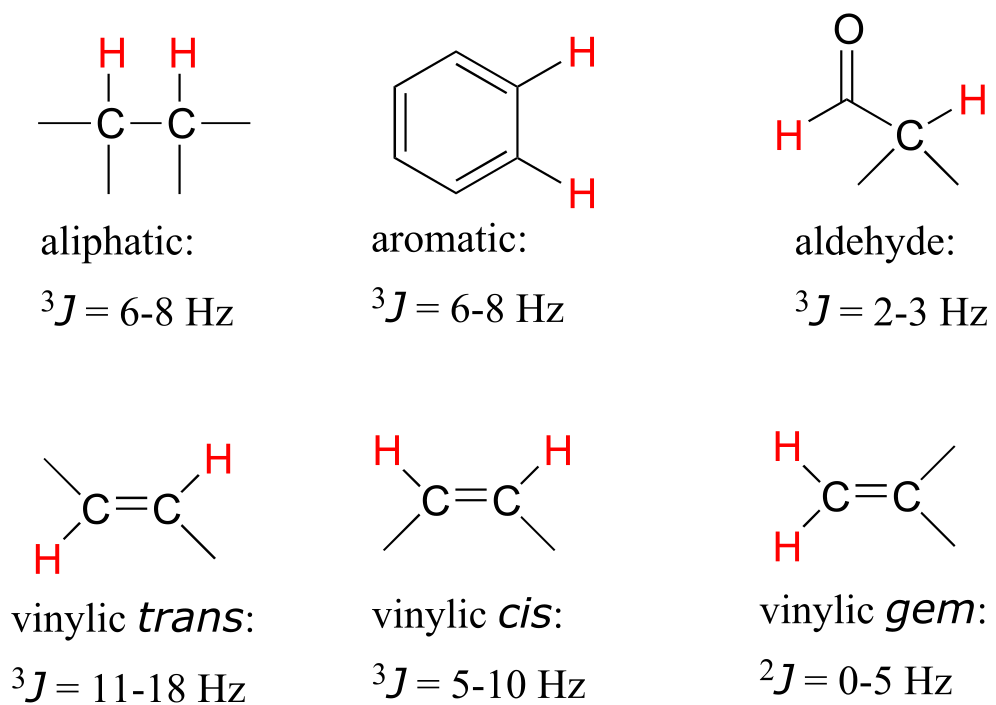
fig 31b
For vinylic protons in a trans configuration, we see coupling constants in the range of 3J = 11-18 Hz, while cis protons couple in the 3J = 5-10 Hz range. The 2-bond coupling between protons on the same alkene carbon (referred to as geminal protons) is very fine, generally 5 Hz or lower.
Fine coupling (2-3 Hz) is often seen between an aldehyde proton and a three-bond neighbor.
Exercise 5.11: Give the expected splitting patterns and approximate coupling constants for the labeled protons in the compound below.
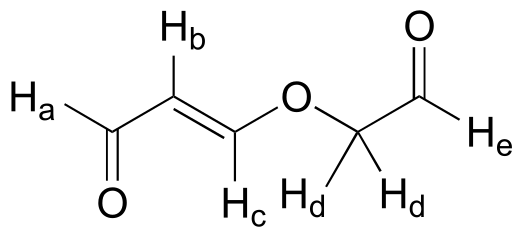
fig 31f
Presenting NMR data in table format
Information from NMR can be recorded conveniently in a condensed form without having to reproduce the actual spectrum. For example, the information from the 1H-NMR specta of ethyl acetate and methylbenzene (see earlier figures) can be presented in tabular format, listing the chemical shift, the peak splitting pattern, and the relative area under peaks (usually, the smallest peak is set to 1). Coupling constant information is not shown in the example tables below.
1H-NMR spectrum of ethyl acetate:
δ (ppm) |
splitting |
integration |
|---|---|---|
3.92 |
q |
1 |
1.83 |
s |
1.5 |
1.06 |
t |
1.5 |
1H-NMR spectrum of methylbenzene:
δ (ppm) |
splitting |
integration |
|---|---|---|
7.45-7.63 |
m |
1.67 |
2.64 |
s |
1 |
(abbreviations: s = singlet, d = doublet, t = triplet, q = quartet, m = multiplet)
Exercise 5.12: Match the 1H-NMR spectrum below to its corresponding compound, and assign all of the signals.
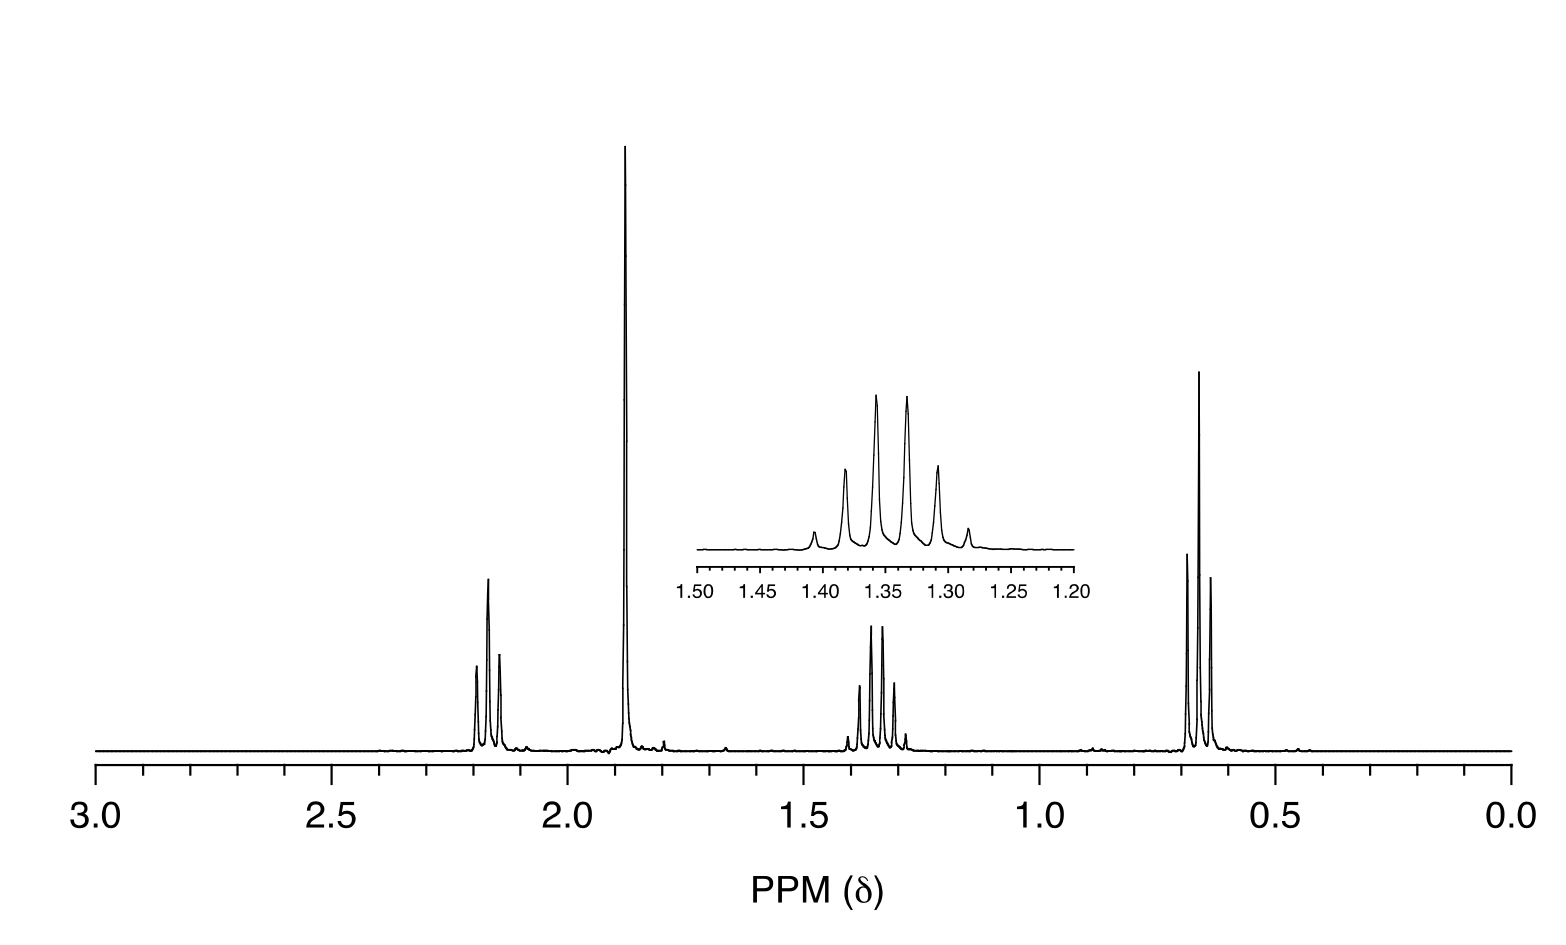
fig 29a
a) cyclopentanone b) 3-pentanone c) butaldehyde
d) 2-pentanone e) 4-heptanone f) 1-butene
Exercise 5.13:
a) Which of the compounds in the previous exercise is expected to have an 1H-NMR spectrum consisting of two triplets and a sextet?
b) Which would have a spectrum consisting of two triplets?
c) Which would have a spectrum that includes a signal above 8 ppm?
Exercise 5.14: Explain how you could distinguish among the 1H-NMR spectra of the three isomers below.
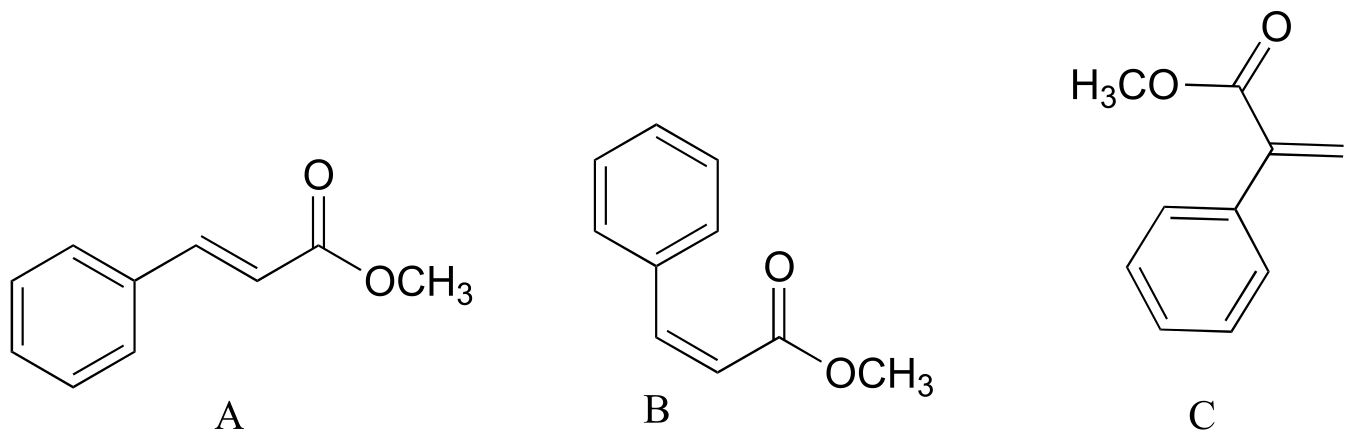
fig 31e
5.6: 13C-NMR spectroscopy#
The 12C isotope of carbon - which accounts for up about 99% of the carbons in organic molecules - does not have a nuclear magnetic moment, and thus is NMR-inactive. Fortunately for organic chemists, however, the 13C isotope, which accounts for most of the remaining 1% of carbon atoms in nature, has a magnetic dipole moment just like protons. Most of what we have learned about 1H-NMR spectroscopy also applies to 13C-NMR, although there are several important differences.
The magnetic moment of a 13C nucleus is much weaker than that of a proton, meaning that NMR signals from 13C nuclei are inherently much weaker than proton signals. This, combined with the low natural abundance of 13C, means that it is much more difficult to observe carbon signals: more sample is required, and often the data from hundreds of scans must be averaged in order to bring the signal-to-noise ratio down to acceptable levels. Unlike 1H-NMR signals, the area under a 13C-NMR signal cannot easily be used to determine the number of carbons to which it corresponds. The signals for some types of carbons are inherently weaker than for other types – peaks corresponding to carbonyl carbons, for example, are much smaller than those for methyl or methylene (CH2) peaks. For this reason, peak integration is generally not useful in 13C-NMR spectroscopy.
The resonance frequencies of 13C nuclei are lower than those of protons in the same applied field - in an instrument with a 7.05 Tesla magnet, protons resonate at about 300 MHz, while carbons resonate at about 75 MHz. This is fortunate, as it allows us to look at 13C signals using a completely separate ‘window’ of radio frequencies. Just like in 1H-NMR, the standard used in 13C-NMR experiments to define the 0 ppm point is tetramethylsilane (TMS), although of course in 13C-NMR it is the signal from the four equivalent carbons in TMS that serves as the standard. Chemical shifts for 13C nuclei in organic molecules are spread out over a much wider range than for protons – up to 200 ppm for 13C compared to 10-12 ppm for protons (see Table 3 for a list of typical 13C-NMR chemical shifts).
The chemical shift of a 13C nucleus is influenced by essentially the same factors that influence a proton’s chemical shift: bonds to electronegative atoms and diamagnetic anisotropy effects tend to shift signals downfield (higher resonance frequency). In addition, sp2 hybridization results in a large downfield shift. The 13C-NMR signals for carbonyl carbons are generally the furthest downfield (170-220 ppm), due to both sp2 hybridization and to the double bond to oxygen.
Exercise 5.15: How many sets of non-equivalent carbons are there in each of the molecules shown in exercise 5.2?
Exercise 5.16: How many sets of non-equivalent carbons are there in:
a) methylbenzene
b) 2-pentanone
c) 1,4-dimethylbenzene
d) triclosan
(all structures are shown earlier in this chapter)
Because of the low natural abundance of 13C nuclei, it is very unlikely to find two 13C atoms near each other in the same molecule, and thus we do not see spin-spin coupling between neighboring carbons in a 13C-NMR spectrum. 13C nuclei are coupled to nearby protons, however, which results in complicated spectra. For clarity, chemists generally use a technique called broadband decoupling, which essentially ‘turns off’ C-H coupling, resulting in a spectrum in which all carbon signals are singlets. Below is the proton-decoupled 13C-NMR sectrum of ethyl acetate, showing the expected four signals, one for each of the carbons. We can also see a signal for the carbon atom in the deuterated chloroform (CDCl3) solvent (although a detailed discussion is beyond our scope here, it is interesting to note that this signal is split into a triplet by deuterium, which is NMR active and has three possible spin states rather than two). We can ignore the solvent signal when interpreting 13C-NMR spectra.

fig 30
While broadband decoupling results in a much simpler spectrum, useful information about the presence of neighboring protons is lost. However, another NMR technique called DEPT (Distortionless Enhancement by Polarization Transfer) allows us to determine how many hydrogens are bound to each carbon. This information is usually provided in problems in which you are asked to interpret the 13C-NMR spectrum of an unknown compound. (Details of how the DEPT technique works is beyond the scope of this book, but will be covered if you take a more advanced course in spectroscopy.)
One of the greatest advantages of 13C-NMR compared to 1H-NMR is the breadth of the spectrum - recall that carbons resonate from 0-220 ppm relative to the TMS standard, as opposed to only 0-12 ppm for protons. Because of this, 13C signals rarely overlap, and we can almost always distinguish separate peaks for each carbon, even in a relatively large compound containing carbons in very similar environments. In the proton spectrum of 1-heptanol we saw earlier only the broad singlet of the alcohol proton (Ha) and the triplet for (Hb) are easily analyzed. The other proton signals overlap, making analysis difficult. In the 13C spectrum of the same molecule, however, we can easily distinguish each carbon signal, and we know from this data that our sample has seven nonequivalent carbons. (Notice also that, as we would expect, the chemical shifts of the carbons get progressively lower as they get farther away from the deshielding oxygen.)

fig 32
This property of 13C-NMR makes it very helpful in the elucidation of larger, more complex structures.
Exercise 5.17 : Below are 13C-NMR spectra for methylbenzene (common name toluene) and methyl methacrylate. Match the spectra to the correct structure, and make peak assignments.
fig 35
Spectrum A:

fig 33
Spetrum B:

fig 34
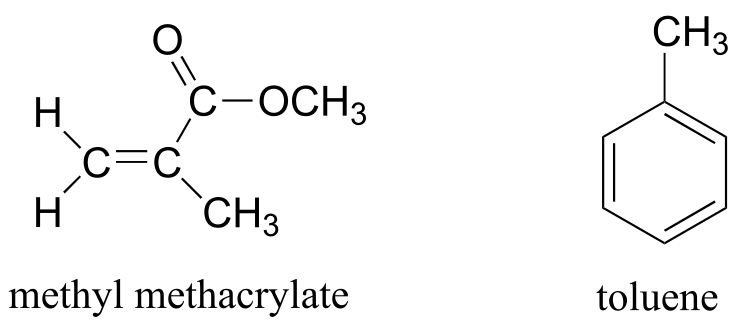
Exercise 5.18: 13C-NMR data for some common biomolecules are shown below (data is from the Aldrich Library of 1H and 13C NMR). Match the NMR data to the correct structure, and make complete peak assignments.
spectrum a: 168.10 ppm (C), 159.91 ppm (C), 144.05 ppm (CH), 95.79 ppm (CH)
spectrum b: 207.85 ppm (C), 172.69 ppm (C), 29.29 ppm (CH3)
spectrum c: 178.54 ppm (C), 53.25 ppm (CH), 18.95 ppm (CH3)
spectrum d: 183.81 ppm (C), 182. 63 ppm (C), 73.06 ppm (CH), 45.35 ppm (CH2)
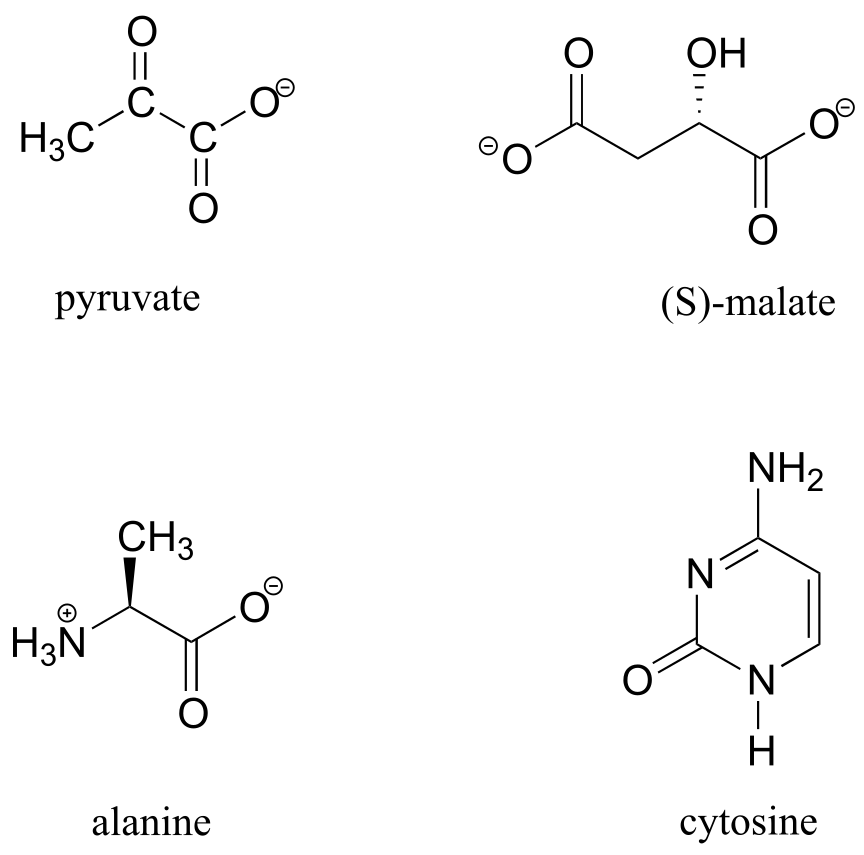
fig 36a
13C-NMR in isotopic labeling studies
Although only about 1 out of 100 carbon atoms in a naturally occurring organic molecule is a 13C isotope, chemists are often able to synthesize molecules that are artificially enriched in 13C at specific carbon positions. This can be very useful in biochemical studies, because it allows us to ‘label’ one or more carbons in a small precursor molecule and then trace the presence of the 13C label through a biosynthetic pathway all the way to the final product, providing insight into how the biosynthesis occurs. For example, scientists were able to grow bacteria in a medium in which the only source of carbon was acetate enriched in 13C at the C1 (carbonyl) position. When they isolated an isoprenoid compound called amino-bacterio-hopanetriol synthesized by the bacteria and looked at its 13C-NMR spectrum, they observed that the 13C label from acetate had been incorporated at eight specific positions. They knew this because the 13C-NMR signals for these carbons were much stronger compared to the same signals in a control (unlabeled) compound.
This result was very surprising - the scientists had expected a completely different pattern of 13C incorporation based on what they believed to be the isoprenoid biosynthesis pathway involved. This unexpected result led eventually to the discovery that bacteria synthesize isoprenoid compounds by a completely different pathway then yeasts, plants, and animals. The newly discovered bacterial metabolic pathway is currently a key target for the development of new antibiotic and antimalaria drugs. (Eur. J. Biochem. 1988, 175, 405).
fig 44
5.7: Solving unknown structures#
Now it is finally time to put together all that we have studied about structure determination techniques and learn how to actually solve the structure of an organic molecule ‘from scratch’ - starting, in other words, with nothing but the raw experimental data. For this exercise, we will imagine that we have been given a vial containing a pure sample of an unknown organic compound, and that this compound to our knowledge has never before been synthesized, isolated, or characterized - we are the first to get our hands on it. Can we figure out its structure? While of course the exact method of determining an unknown structure will depend on the compound in question and, in the real world of research, will probably involve some techniques that are beyond the scope of this book, here is an overview of an approach that could be taken to analyze a pure sample of a relatively simple organic compound, using the techniques we have learned about.
Step 1: Use MS and combustion analysis to determine the molecular formula
Before we start analyzing spectroscopic data, we need one very important piece of information about our compound - its molecular formula. This can be determined through the combined use of mass spectrometry and combustion analysis. We will not go into the details of combustion analysis - for now, it is enough to know that this technique tells us the mass percent of each element in the compound. Because molecular oxygen is involved in the combustion reaction, oxygen in the sample is not measured directly - but we assume that if the mass percentages do not add up to 100%, the remainder is accounted for by oxygen.
When we obtain our unknown compound, one of the first things we will do is to send away a small quantity to an analytical company specializing in combustion analysis. They send us back a report stating that our compound is composed, by mass, of 52.0% carbon, 38.3% chlorine, and 9.7% hydrogen. This adds up to 100%, so our compound does not contain any oxygen atoms.
In order to determined the molecular formula of our compound from this data, we first need to know its molar mass. This piece of information, as you recall from chapter 4, we determine by looking at the ‘molecular ion peak’ in the mass spectrum of our compound. In this example, we find that our MS data shows a molecular ion peak at m/z = 92, giving us a molar mass of 92 g/mole (remember that in the MS experiment, charge (z) is almost always equal to 1, because we are looking at +1 cations).
So, one mole of our compound is 92g. How many moles of carbon atoms are in one mole of the compound? Simple: 52% of 92g is 47.8g. So in one mole of our compound, there is about 48 g of carbon, which means four moles of carbon. With similar calculations, we find that one mole of our compound contains nine hydrogens and one chlorine. Therefore our molecular formula is C4H9Cl.
Step 2: Calculate the Index of Hydrogen Deficiency
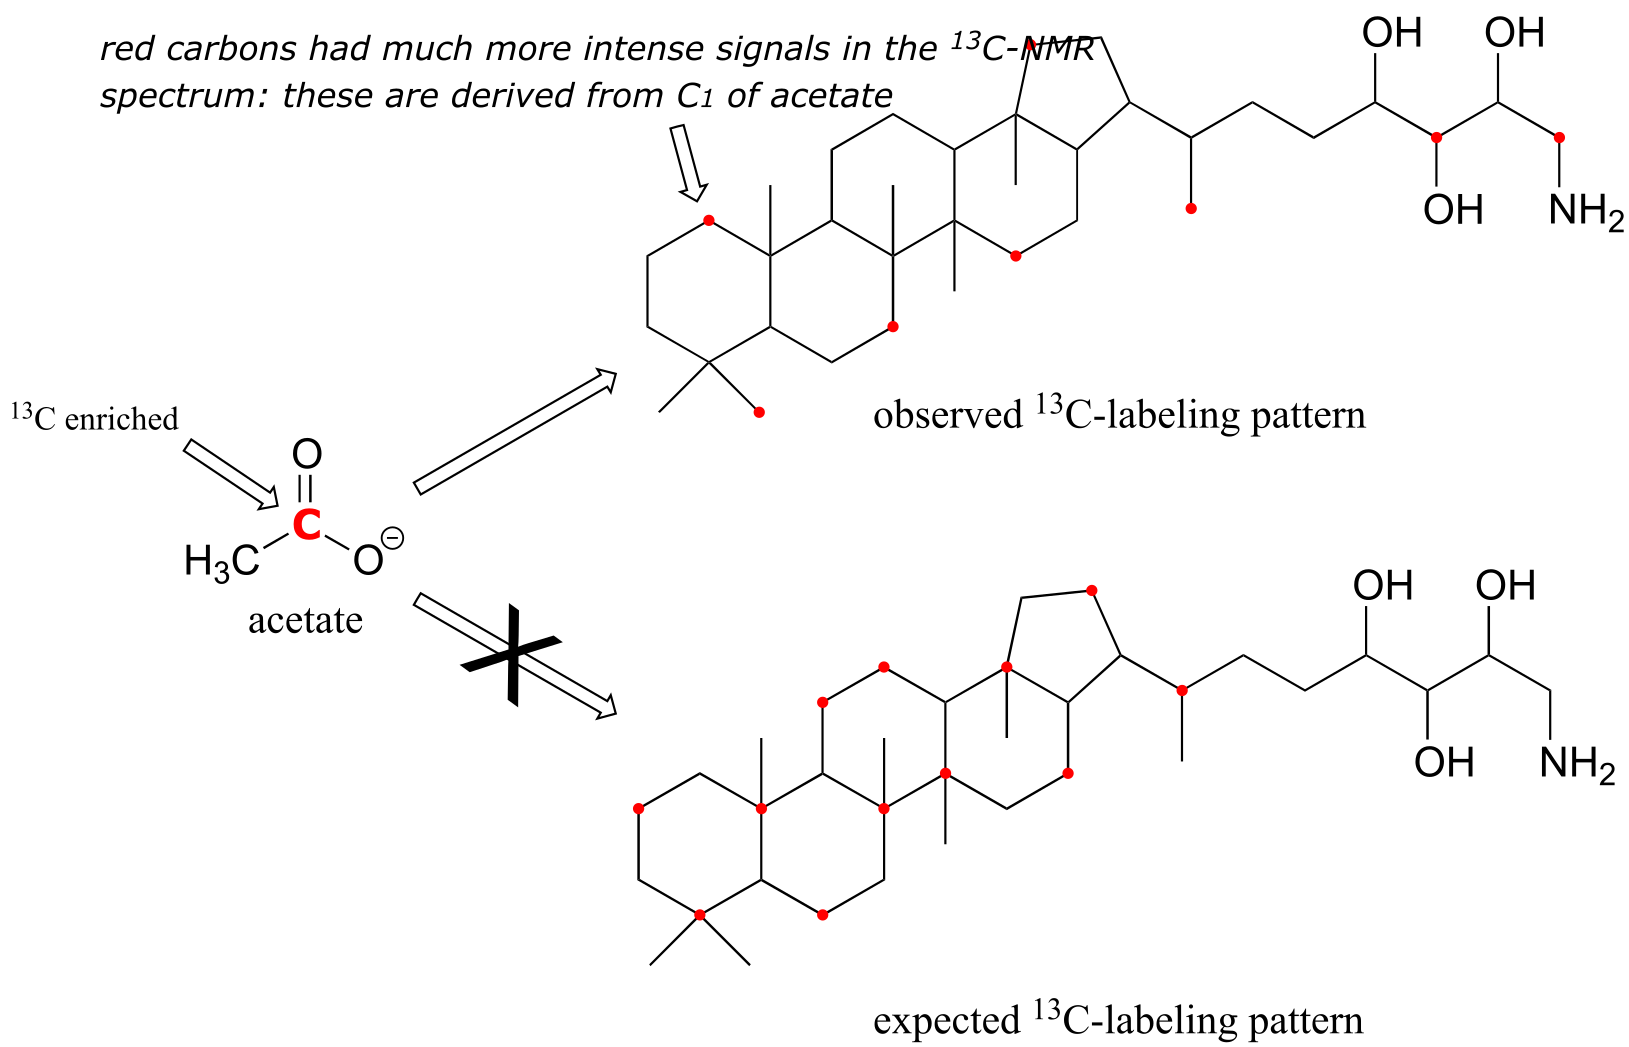
The next step is to calculate a number called the Index of Hydrogen Deficiency (IHD) from the molecular formula. The IHD will tell us how many multiple bonds and/or ring structures our molecule has - very useful information. The idea behind the IHD is very simple: the presence of a double bond or a ring structure means that two fewer hydrogen atoms can be part of the compound. The formula for calculating IHD from a molecular formula is:
Calculating Index of Hydrogen Deficiency:
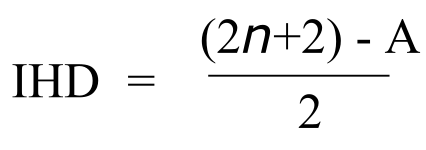
where:
n = number of carbon atoms
A = (number of hydrogen atoms) + (number of halogen atoms) - (number of nitrogen atoms) - (net charge)
fig 36
For example, a molecule with the molecular formula C6H14 would have n = 6 and A = 14, so we can calculate that IHD = 0 and thereby know that a compound with this formula has no double bonds or ring structures. Hexane and 2-methyl pentane are two examples of compounds that apply.
A molecular formula of C6H12, on the other hand, corresponds to IHD = 1, so a compound with this formula should have one double bond or one ring structure. Cyclohexane (one ring structure) and 2-hexene (one double bond) are two possibilities. Benzene (C6H6) , and methyl benzene (C7H8) both have IHD = 4, corresponding in both cases to three π bonds and one ring. An IHD value of 4 or greater is often an indicator that an aromatic ring is present.
Exercise 5.19:
a) What is the IHD that corresponds to a molecular formula C6H12O? Draw the structures of three possible compounds that fit.
b) The amino acid alanine has molecular formula C2H8NO2+ in aqueous buffer of pH = 2. Calculate the IHD. Then, draw the relevant structure to confirm that this IHD makes sense.
c) What is the IHD of the compounds below? (Hint: you don’t need to figure out molecular formulas!)
fig 36b
The formula for our structure determination sample, C4H9Cl, corresponds to IHD = 0, meaning that our compound contains no multiple bonds or rings.
Step 3: Use available spectroscopy data to identify discrete parts of the structure.
In this problem, we have proton and carbon NMR data to work with (other problems may include IR and/or UV/Vis data).
1H-NMR:
δ (ppm) |
splitting |
integration |
|---|---|---|
3.38 |
d |
2 |
1.95 |
m |
1 |
1.01 |
d |
6 |
13C-NMR:
52.49 (CH2)
31.06 (CH)
20.08 (CH3)
The process of piecing together an organic structure is very much like putting together a puzzle. In every case we start the same way, determining the molecular formula and the IHD value. After that, there is no set formula for success- what we need to do is figure out as much as we can about individual pieces of the molecule from the NMR (and often IR, MS, or UV-Vis) data, and write these down. Eventually, hopefully, we will be able to put these pieces together in a way that agrees with all of our empirical data. Let’s give it a go.
We see that there are only three signals in each NMR spectrum, but four carbons in the molecule, which tells us that two of the carbons are chemically equivalent. The fact that the signal at 1.01 ppm in the proton spectrum corresponds to six protons strongly suggests that the molecule has two equivalent methyl (CH3) groups. Because this signal is a doublet, there must be a CH carbon bound to each of these two methyl groups. Taken together, this suggests:
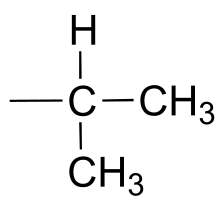
fig 37
The 1H-NMR signal at 3.38 ppm must be for protons bound to the carbon which is in turn bound to the chlorine (we infer this because this signal is the furthest downfield in the spectrum, due to the deshielding effect of the electronegative chlorine). This signal is for two protons and is a doublet, meaning that there is a single nonequivalent proton on an adjacent carbon.
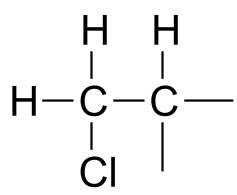
fig 38
Step 4: Try to put the pieces of the puzzle together, and see if everything fits the available data.
At this point, we have accounted for all of the atoms in the structure, and we have enough information to put together a structure that corresponds to 1-chloro-2-methylpropane.
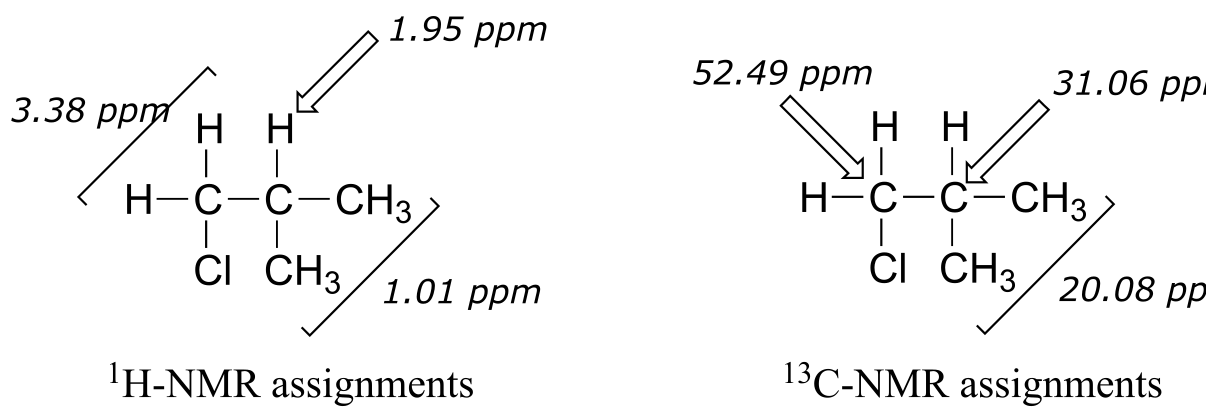
fig 39
To confirm, we make assignment all NMR signals to their corresponding atoms and make sure that our structure fits all of the NMR data. Notice that the proton peak at 1.95 ppm might be expected to be a ‘9-tet’ because of its eight 3-bond neighbors: however, two of the neighbors are different from the other six, and may not couple to exactly the same extent. The signal at 1.95 will not, then, be a ‘clean’ 9-tet, and we would call it a multiplet.
Exercise 5.20:
Three constitutional isomers of 1-chloro-2-methylpropane produce the following NMR data. Assign structures to the three compounds, and make all peak assignments.
Compound A: (2-chloro-2-methylpropane)
1H-NMR:
1.62 ppm, 9H, s
13C-NMR:
67.14 ppm (C)
34. 47 ppm (CH3)
Compound B: (1-chlorobutane) 1H-NMR: 3.42 ppm, 2H, t 1.68 ppm, 2H, p 1.41 ppm, 2H, sextet 0.92 ppm, 3H, t 13C-NMR: 44.74 ppm (CH2) 34.84 ppm (CH2) 20.18 ppm (CH2) 13.34 ppm (CH3) |
Compound C: (2-chlorobutane) 1H-NMR: 3.97 ppm, 1H, sextet 1.71 ppm, 2H, p 1.50 ppm, 3H, d 1.02 ppm, 3H, t 13C-NMR: 60.34 ppm (CH) 33.45 ppm (CH2) 24.94 ppm (CH3) 11.08 ppm (CH3) |
|---|
Let’s try another problem, this time incorporating IR information. The following data was obtained for a pure sample of an unknown organic compound:
Combustion analysis:
C: 85.7%
H: 6.67%
MS: Molecular ion at m/z = 210
1H-NMR:
7.5-7.0, 10H, m
5.10, 1H, s
2.22, 3H, s
13C-NMR:
206.2 (C) 128.7 (CH) 30.0 (CH3)
138.4 (C) 127.2 (CH)
129.0 (CH) 65.0 (CH)
IR: 1720 cm-1, strong (there are of course many other peaks in the IR spectrum, but this is the most characteristic one)
The molecular weight is 210, and we can determine from combustion analysis that the molecular formula is C15H14O (the mass percent of oxygen in the compound is assumed to be 100 - 85.7 - 6.67 = 7.6 %). This gives us IHD = 9.
Because we have ten protons with signals in the aromatic region (7.5-7.0 ppm), we are probably dealing with two phenyl groups, each with one substituted carbon. The 13C-NMR spectrum shows only four signals in the range for aromatic carbons, which tells us that the two phenyl groups must be in equivalent electronic environments (if they are in different environments, they would give rise to eight signals).
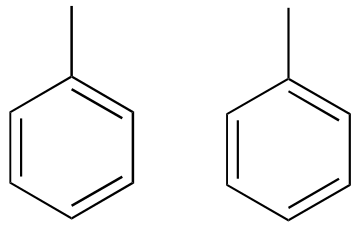
fig 40
This accounts for 12 carbons, 10 hydrogens, and 8 IHD units. Notice that the carbon spectrum has only six peaks - and only four peaks in the aromatic region! This again indicates that the two phenyl groups are in chemically equivalent positions
The IR spectrum has a characteristic carbonyl absorption band, so that accounts for the oxygen atom in the molecular formula, the one remaining IHD unit, and the 13C-NMR signal at 206.2 ppm.
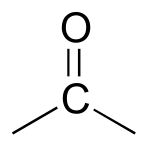
fig 41
Now we only have two carbons and four hydrogens left to account for. The proton spectrum tells us we have a methyl group (the 2.22 ppm singlet) that is not split by neighboring protons. Looking at the table of typical chemical shifts, we see that this chemical shift value is in the range of a carbon next to a carbonyl.
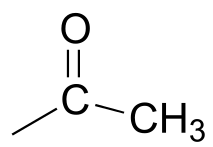
fig 42
Finally, there is one last proton at 5.10 ppm, also a singlet. Putting the puzzle together, the only possibility that fits is 1,1-diphenyl-2-propanone:
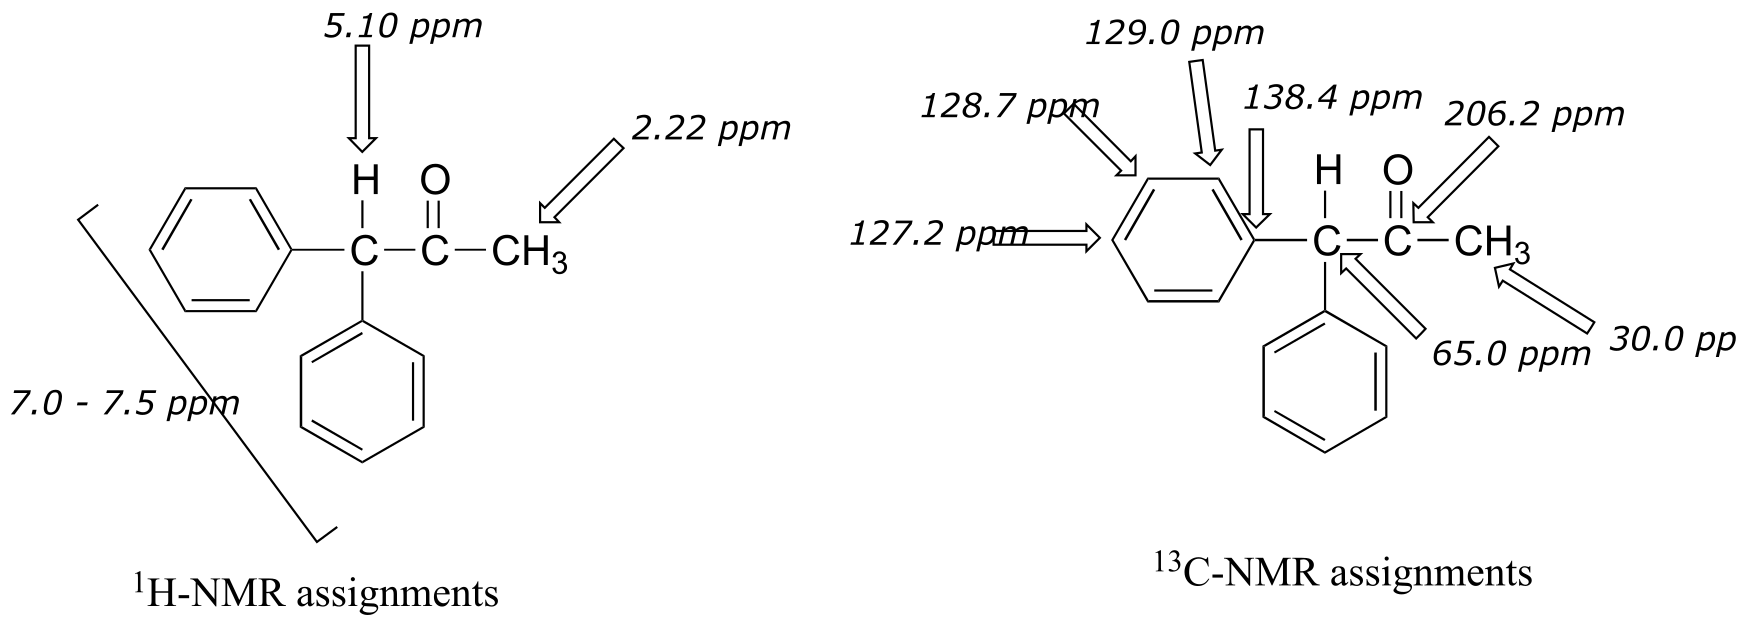
fig 43
5.8: Complex coupling in 1H-NMR spectra#
In all of the examples of spin-spin coupling we saw in our discussion of proton NMR, the observed splitting resulted from the coupling of one set of protons to just one neighboring set of protons. When a set of protons is coupled to two sets of nonequivalent neighbors, with significantly different coupling constants, the result is a phenomenon called complex coupling. A good illustration is provided by the 1H-NMR spectrum of methyl acrylate:

fig 45
Note that all three vinylic protons in methyl acrylate (designated above as Ha, Hb and Hc) are separated from each other by three bonds or less, and thus are all spin-coupled. For example, Hc is gem-coupled to Hb (J = 1.5 Hz), and Hc is also trans-coupled to Ha (J = 17.4 Hz). You might think that the n+1 rule would tell us that because Hc has two nonequivalent neighbors - Ha and Hb - its NMR signal should be a triplet. This would be correct if Jac and Jbc were the same, or very close. However, because the two coupling constants are in fact very different from each other, the signal for Hc is clearly not a triplet. Here is a further expansion of the Hc signal:

fig 46
You can see that the Hc signal is actually composed of four sub-peaks. Why is this? A splitting diagram can help us to understand what we are seeing. Ha is trans to Hc across the double bond, and splits the Hc signal into a doublet with a coupling constant of 3Jac = 17.4 Hz. In addition, each of these Hc doublet sub-peaks is split again by Hb (geminal coupling) into two more doublets, each with a much smaller coupling constant of 2Jbc = 1.5 Hz.
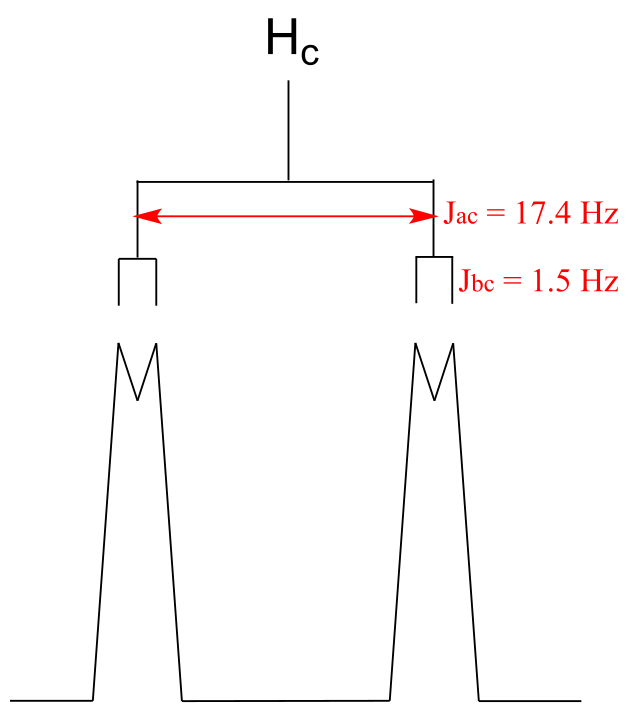
fig 47
The result of this `double splitting` is a pattern referred to as a doublet of doublets, abbreviated `dd`.
The reported chemical shift of Hc is 6.210 ppm, the average of the four sub-peaks.
Exercise 5.21: Assume that on a 300 MHz spectrometer, the chemical shift of Hc, expressed in Hz, is 1863.0 Hz. What is the chemical shift, to the nearest 0.1 Hz, of the furthest upfield subpeak in the Hc signal?
The signal for Ha at 5.950 ppm is also a doublet of doublets, with coupling constants 3Jac = 17.4 Hz and 3Jab = 10.5 Hz.
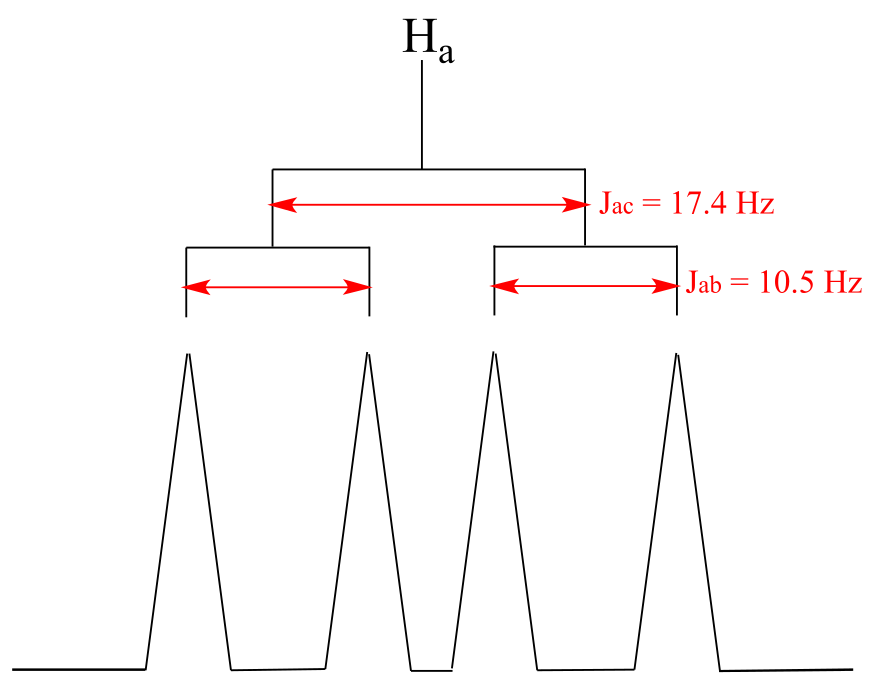
fig 48
The signal for Hb at 5.64 ppm is split into a doublet by Ha, a cis coupling with 3Jab = 10.4 Hz. Each of the resulting sub-peaks is split again by Hc, with the same geminal coupling constant 2Jbc = 1.5 Hz that we saw previously when we looked at the Hc signal. The overall result is again a doublet of doublets, this time with the two `sub-doublets` spaced slightly closer due to the smaller coupling constant for the cis interaction.
Exercise 5.22 : Construct a splitting diagram for the Hb signal in the 1H-NMR spectrum of methyl acrylate. The chemical shift of Hb, in Hz, is 1691 Hz - label the chemical shifts (in Hz) of each of the four sub-peaks.
Exercise 5.23: Explain how the signals for Hb and Hc of methyl acrylate can be unambiguously assigned.
When constructing a splitting diagram to analyze complex coupling patterns, it is conventional (and simpler) to show the broader splitting first, followed by the finer splitting: thus we show the broad Ha-Hc splitting first, then the fine Hb-Hc splitting.
In the methyl acrylate spectrum, the signals for each of the three vinylic protons was a doublet of doublets (abbreviated ‘dd’). Other complex splitting patterns are possible: triplet of doublets (td), doublet of triplets (dt), doublet of quartets (dq), and so on. Remember that the broader splitting is listed first, thus a triplet of doublets is different from a doublet of triplets.
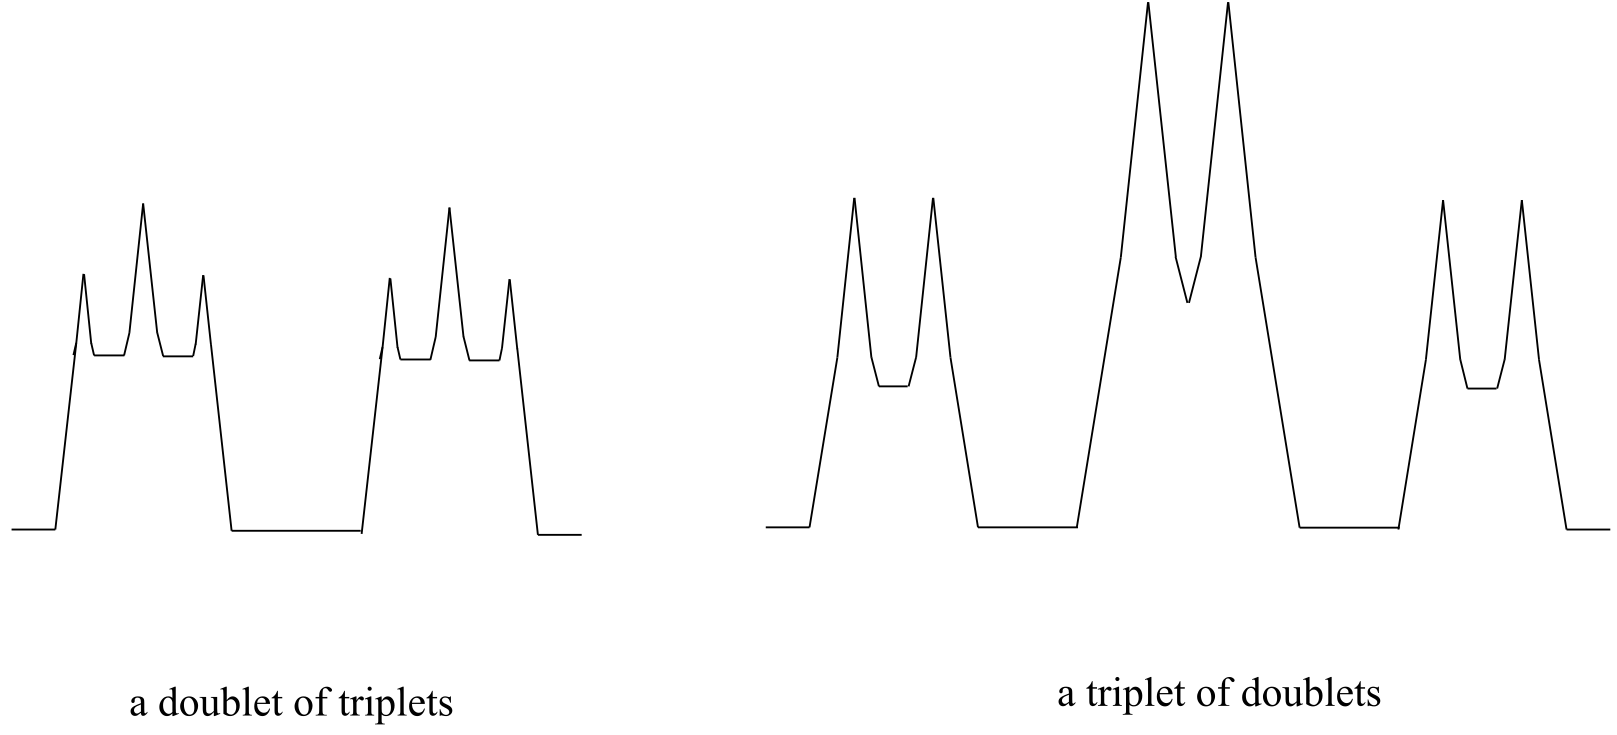
fig 50
Exercise 5.24: Draw a predicted splitting diagram for the signal corresponding to Hb in the structure below, using approximate coupling constants. What would you call the splitting pattern for the Hb signal in this example?
fig 49
Exercise 5.25: A signal in a proton NMR spectrum has multiple sub-peaks with the following chemical shifts values, expressed in Hz: 1586, 1583, 1580, 1572, 1569, 1566. Identify the splitting pattern, and give the coupling constant(s) and the overall chemical shift value (in Hz).
When we start trying to analyze complex splitting patterns in larger molecules, we gain an appreciation for why scientists are willing to pay large sums of money (hundreds of thousands of dollars) for higher-field NMR instruments. Quite simply, the stronger our magnet is, the more resolution we get in our spectrum. In a 100 MHz instrument (with a magnet of approximately 2.4 Tesla field strength), the 12 ppm frequency ‘window’ in which we can observe proton signals is 1200 Hz wide. In a 500 MHz (~12 Tesla) instrument, however, the window is 6000 Hz - five times wider. In this sense, NMR instruments are like digital cameras and HDTVs: better resolution means more information and clearer pictures (and higher price tags!)
**
**
5.9: Other applications of NMR#
A: Magnetic resonance imaging
In the introduction to this chapter, we heard two stories about people whose lives were potentially saved when brain tumors were discovered during a magnetic resonance imaging (MRI) scan. MRI is a powerful diagnostic technique because it allows doctors to visualize internal body tissues while sparing the patient from surgery and potentially harmful, high energy x-rays. The basis for MRI is essentially the same as for NMR: an MRI scanner has a very strong superconducting magnet large enough to completely surround a whole person, much the same way in which a small glass sample tube in an NMR experiment is surrounded by the instrument’s magnet. Once exposed to the strong magnetic field, water protons in the body resonate at different radio frequencies - the variation in resonance frequencies is due to water binding in different ways to different tissue types, creating slightly different electronic environments for the protons. The software in the MRI scanner then translates variations in resonance frequencies to a color scheme, which creates a visual image of the body tissues in the scanned area.
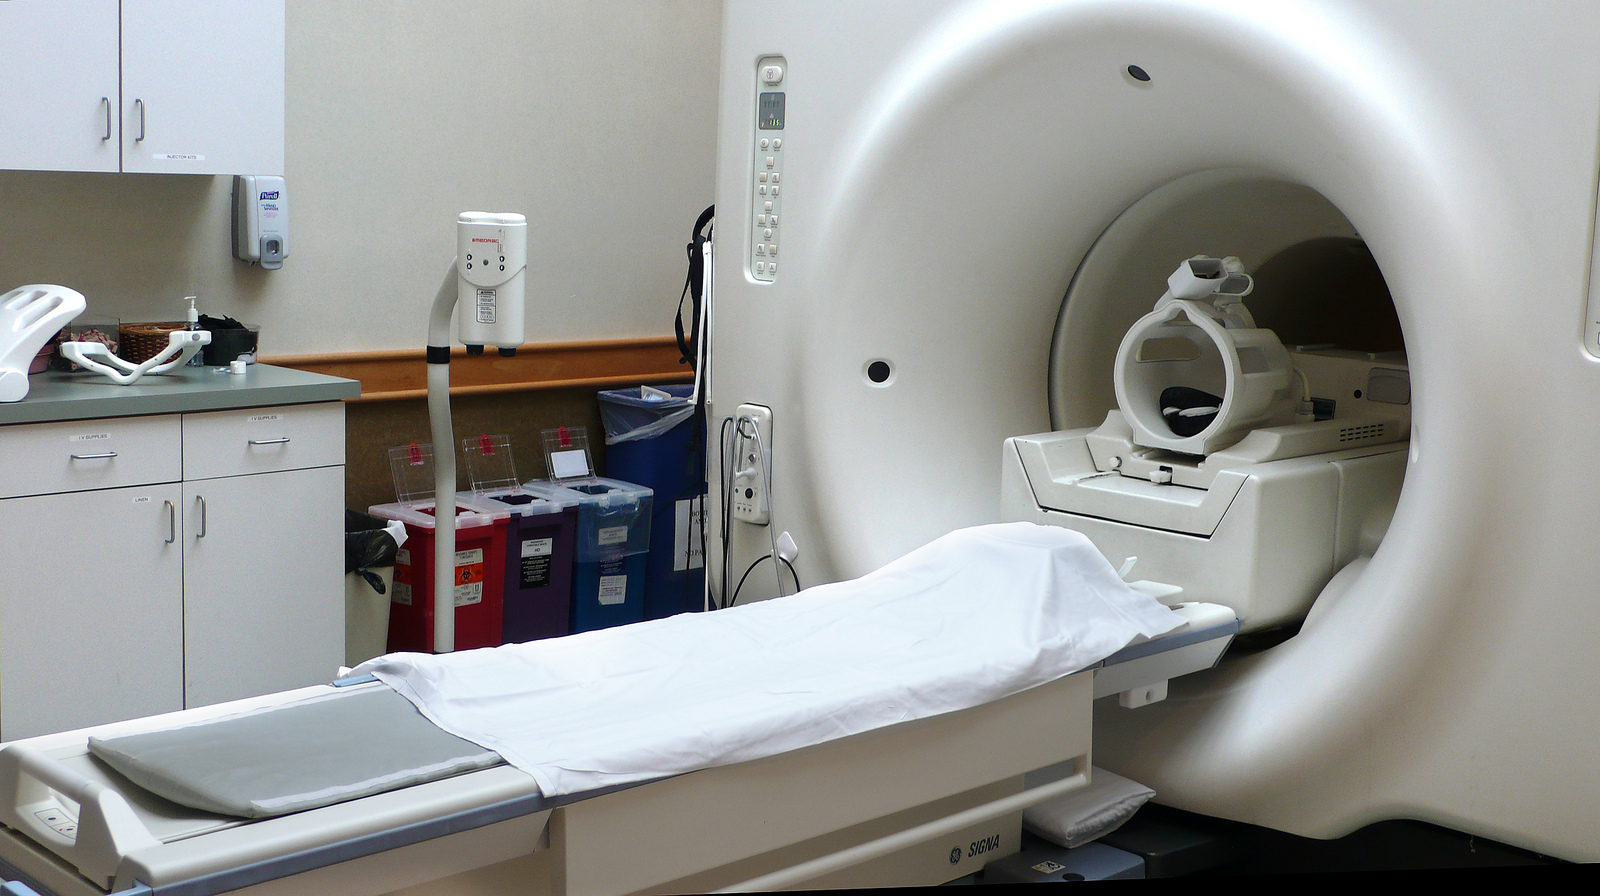
A typical MRI scanner (credit Liz West: https://www.flickr.com/photos/calliope/)
B: NMR of proteins and peptides
In this chapter you have learned enough about NMR to be able to understand how it is used to solve the structures of relatively small organic molecules. But what about really big organic molecules, like proteins?
X-ray crystallography, not NMR, is the most common way to determine the precise three-dimensional structure of a protein, and in a biochemistry class you will look at many images of protein structures derived from x-ray crystallography. While it is an immensely powerful tool for analyzing protein structure, crystallography has two major drawbacks. First, it relies on a researcher being able to get a protein to form regular, ordered crystals, which can be very challenging. Most proteins are globular, meaning they are (very roughly) spherical in shape. For a molecule to form crystals, it must pack together tightly in an ordered, repeating way: think of a neat stack of cube-shaped objects. Spheres, however, are inherently difficult to pack this way. Imagine trying to make a pile of tennis balls - they just roll apart, because so little of each ball’s surface area comes into contact with its neighbor, thus there is very little friction (ie. noncovalent interactions!) holding them together. A large percentage of known proteins simply will not crystallize under any conditions that have been tried - therefore, we cannot determine their structure using x-ray crystallography.
Secondly, a lot of what is most interesting about proteins is how they move: flaps open and close when a substrate binds, or one part of the protein moves over to connect with another part. Protein action is dynamic. A crystal, on the other had, is static, or frozen. A protein structure determined by x-ray crystallography is like a still photograph of leaping dancer: we can infer from the picture what kind of movement might be taking place, but we can’t get a full appreciation of the motion.
This leads to NMR, which of course is done in solution. It is easy to get most proteins into aqueous solution, so there are no worries about trying to make crystals. Also, a protein in solution is free to move, so NMR can potentially capture elements of protein dynamics. So why don’t scientists always use NMR to look at proteins?
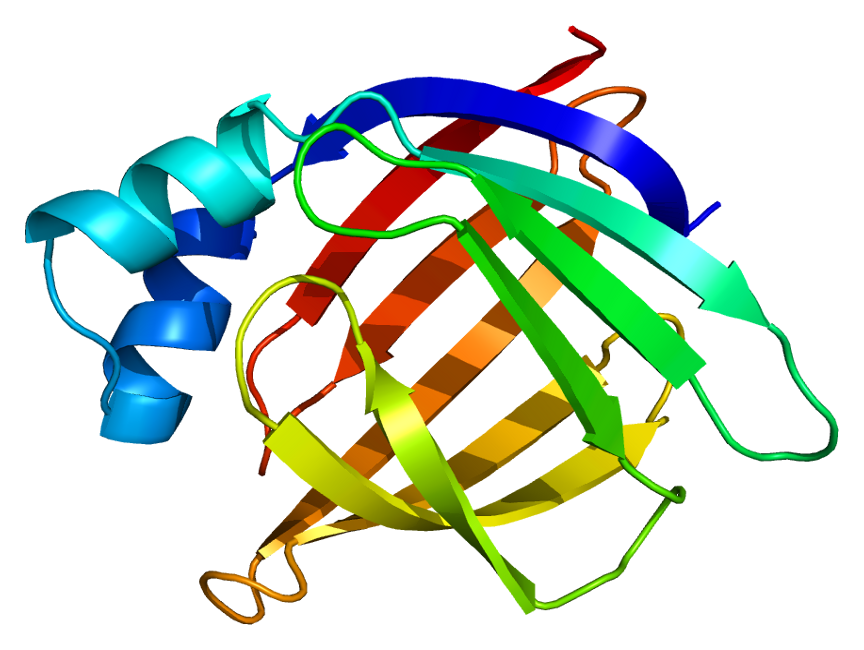
Structure of an intestinal fatty acid binding protein determined by NMR
(credit: Wikipedia commons: https://commons.wikimedia.org/wiki/User:Emw;
After working through a few NMR structure determination problems in this chapter, you have an appreciation for the brainwork required to figure out the structure of a small organic molecule based on its NMR structure: now imagine doing this with a protein, with its thousands of carbon and hydrogen atoms! Nevertheless, spectroscopists are gradually getting better and better at using NMR and computer-power to do just this. The advanced NMR techniques and methods of analysis are far beyond the scope of our discussion here, but you can see how useful it could be to protein scientists to be able to ‘see’ what a protein looks like using NMR, and if you are interested in this area of research you can learn about it in more advanced courses.
Note: The Spectral Database of Organic Compounds is a great resource for looking at NMR spectra (both proton and carbon) for a large number of compounds - the more examples you see, the better!
Summary of Key Concepts#
Before moving on to the next chapter, you should:
Be able to identify groups of chemically equivalent protons and carbon atoms in a structure.
Be able to explain the basis of an NMR experiment in terms of the spin state of a nucleus, the ground state to excited state transition involved, and the frequency of radiation absorbed.
Understand the differences between proton and carbon NMR experiments, and explain why carbon spectra generally have more noise, do not show coupling, and do not suffer from the disadvantage of overlapping peaks. You should be able to explain why 13C-NMR peaks are not usually integrated.
Understand how to look at an NMR spectrum, including the meaning of the ppm label on the x-axis, the meaning of ‘chemical shift’, and the definition of zero ppm on the chemical shift scale.
Be able to predict trends in chemical shifts for protons and carbon atoms in different bonding positions, and provide a rationale for the trend. You should also be able to roughly estimate the chemical shift of a given proton or carbon using Table X or a similar table from another source.
Understand how to use proton peak integration values to determine how many protons a particular peak is ‘worth’.
Be able to explain the physical basis for spin-spin coupling in 1H-NMR spectra, and be able to use the ‘n+1 rule’.
Be able to interpret, and draw splitting diagrams for, 1H-NMR spectra with complex coupling.
Be able to use a 13C-NMR spectrum to identify the number of magnetically nonequivalent types of carbon in an unknown compound.”
Be confident at working problems in which you are asked to match structures to 1H- and/or 13C-NMR spectra.
Given a molecular formula (or a combination of combustion and MS data), you should be confident in your ability to solve an unknown structure based on a 1H- spectrum, possibly in combination with data from 13C-NMR, IR, or UV-Vis spectroscopy.
**
**
Problems#
P5.1:
a) For each molecule below, draw in all hydrogen atoms, and label them Ha, Hb, etc., with chemically equivalent hydrogens having the same label.
b) Predict splitting patterns for all proton signals.
P5.2: For each of the 20 common amino acids, predict the number of signals in the proton-decoupled 13C-NMR spectrum.
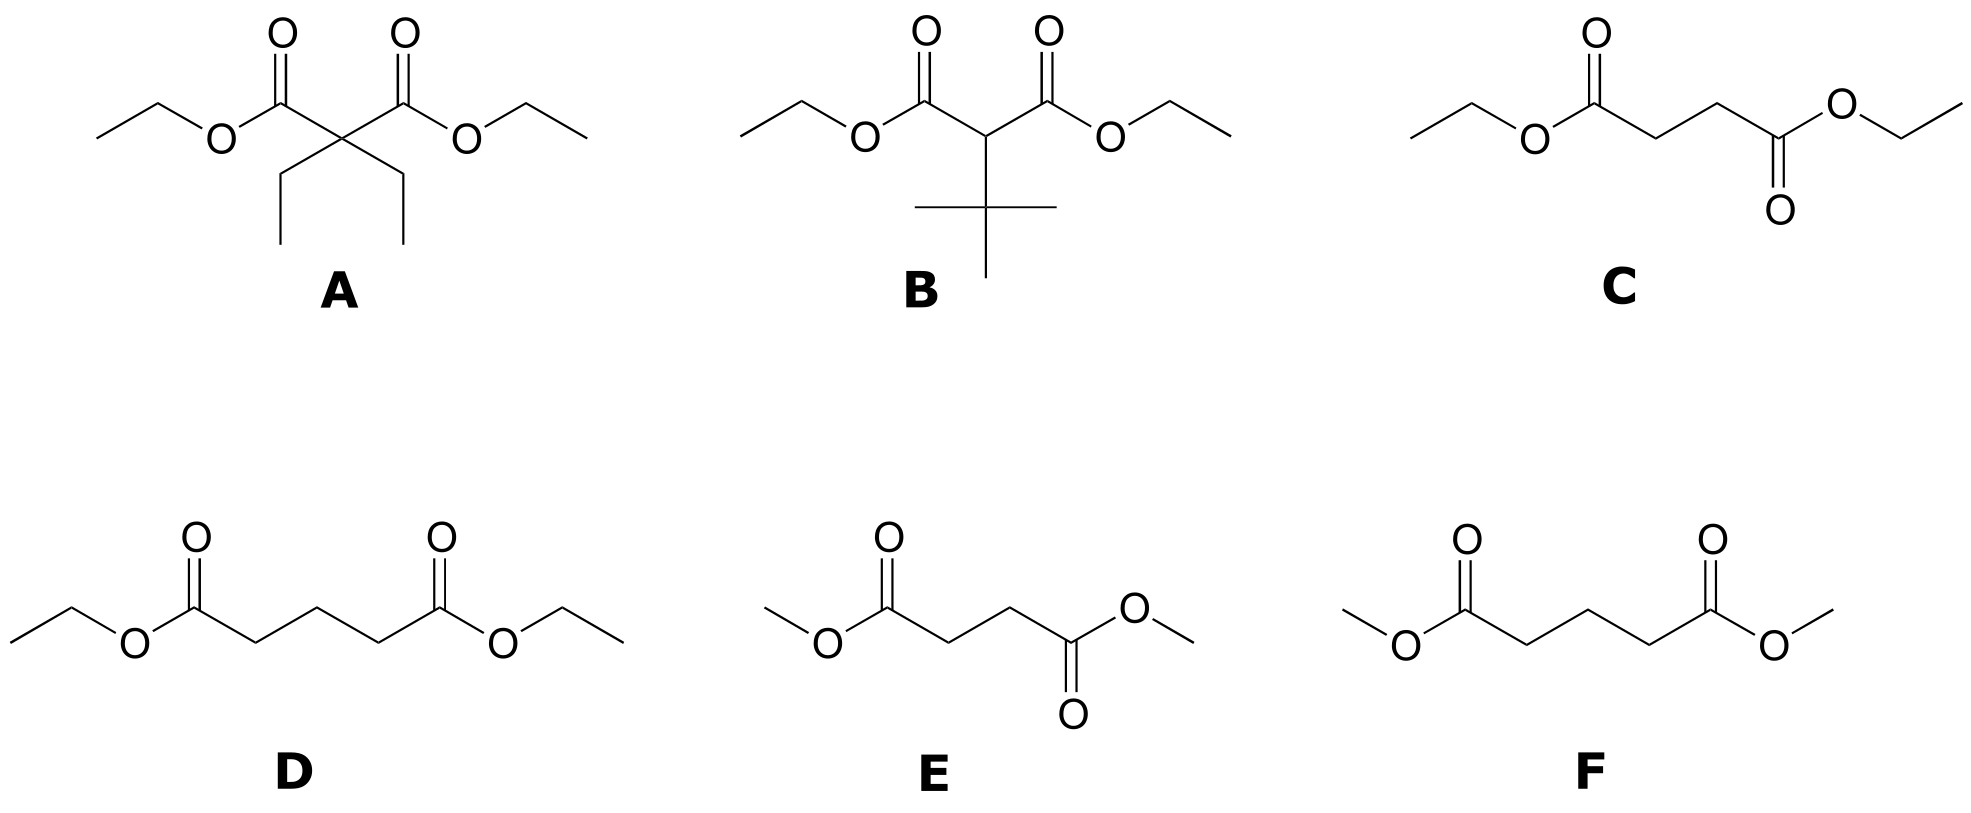
P5.3: Match spectra below to their corresponding structures A-F. Make complete peak assignments for all structures.
(in all 1H-NMR data tables in the following problems, peak relative integration values are listed in which the smallest area peak is equal to 1)
Structures:
Spectrum 1: 1-941C (structure D)
δ (ppm) |
splitting |
integration |
|---|---|---|
4.13 |
q |
2 |
2.45 |
t |
2 |
1.94 |
p |
1 |
1.27 |
t |
3 |
Spectrum 2: 1-941B (structure F)
δ (ppm) |
splitting |
integration |
|---|---|---|
3.68 |
s |
3 |
2.99 |
t |
2 |
1.95 |
p |
1 |
Spectrum 3: 1-940B (structure C)
δ (ppm) |
splitting |
integration |
|---|---|---|
4.14 |
q |
1 |
2.62 |
s |
1 |
1.26 |
t |
1.5 |
Spectrum 4: 1-939C (structure B)
δ (ppm) |
splitting |
integration |
|---|---|---|
4.14 |
q |
4 |
3.22 |
s |
1 |
1.27 |
t |
6 |
1.13 |
s |
9 |
Spectrum 5: 1-938C (structure A)
d (ppm) |
splitting |
integration |
|---|---|---|
4.18 |
q |
1 |
1.92 |
q |
1 |
1.23 |
t |
1.5 |
0.81 |
t |
1.5 |
Spectrum 6: 1-940A (structure E)
d (ppm) |
splitting |
integration |
|---|---|---|
3.69 |
s |
1.5 |
2.63 |
s |
1 |
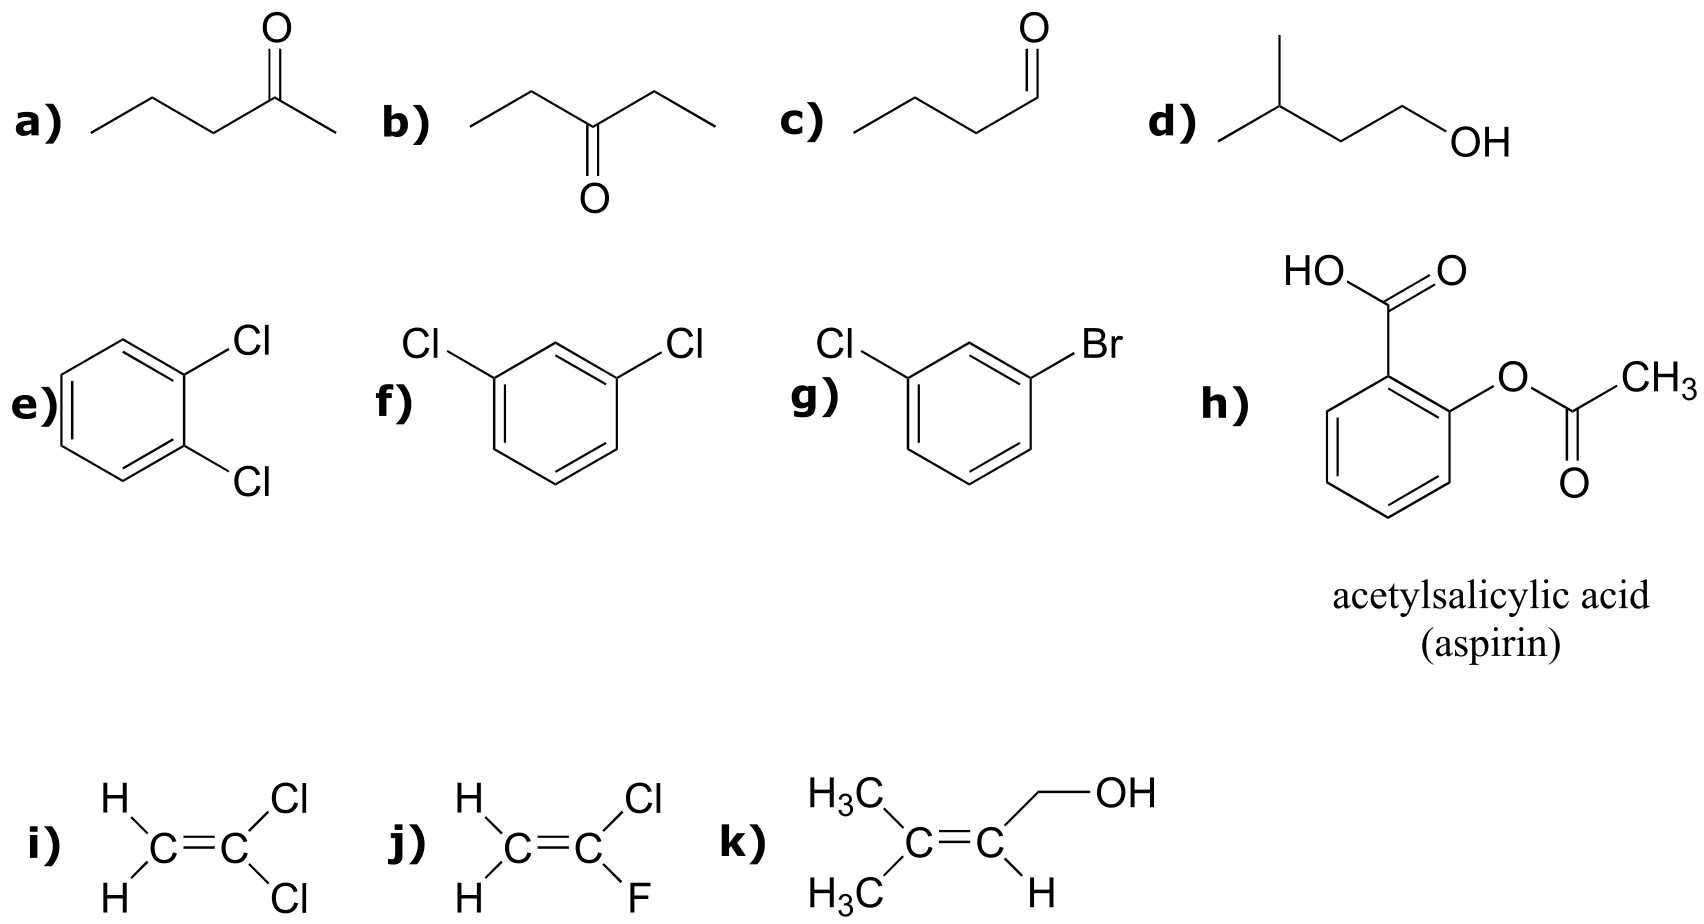
P5.4: Match the 1H-NMR spectra 7-12 to their corresponding structures G-L. Make complete peak assignments for all structures.
Structures:
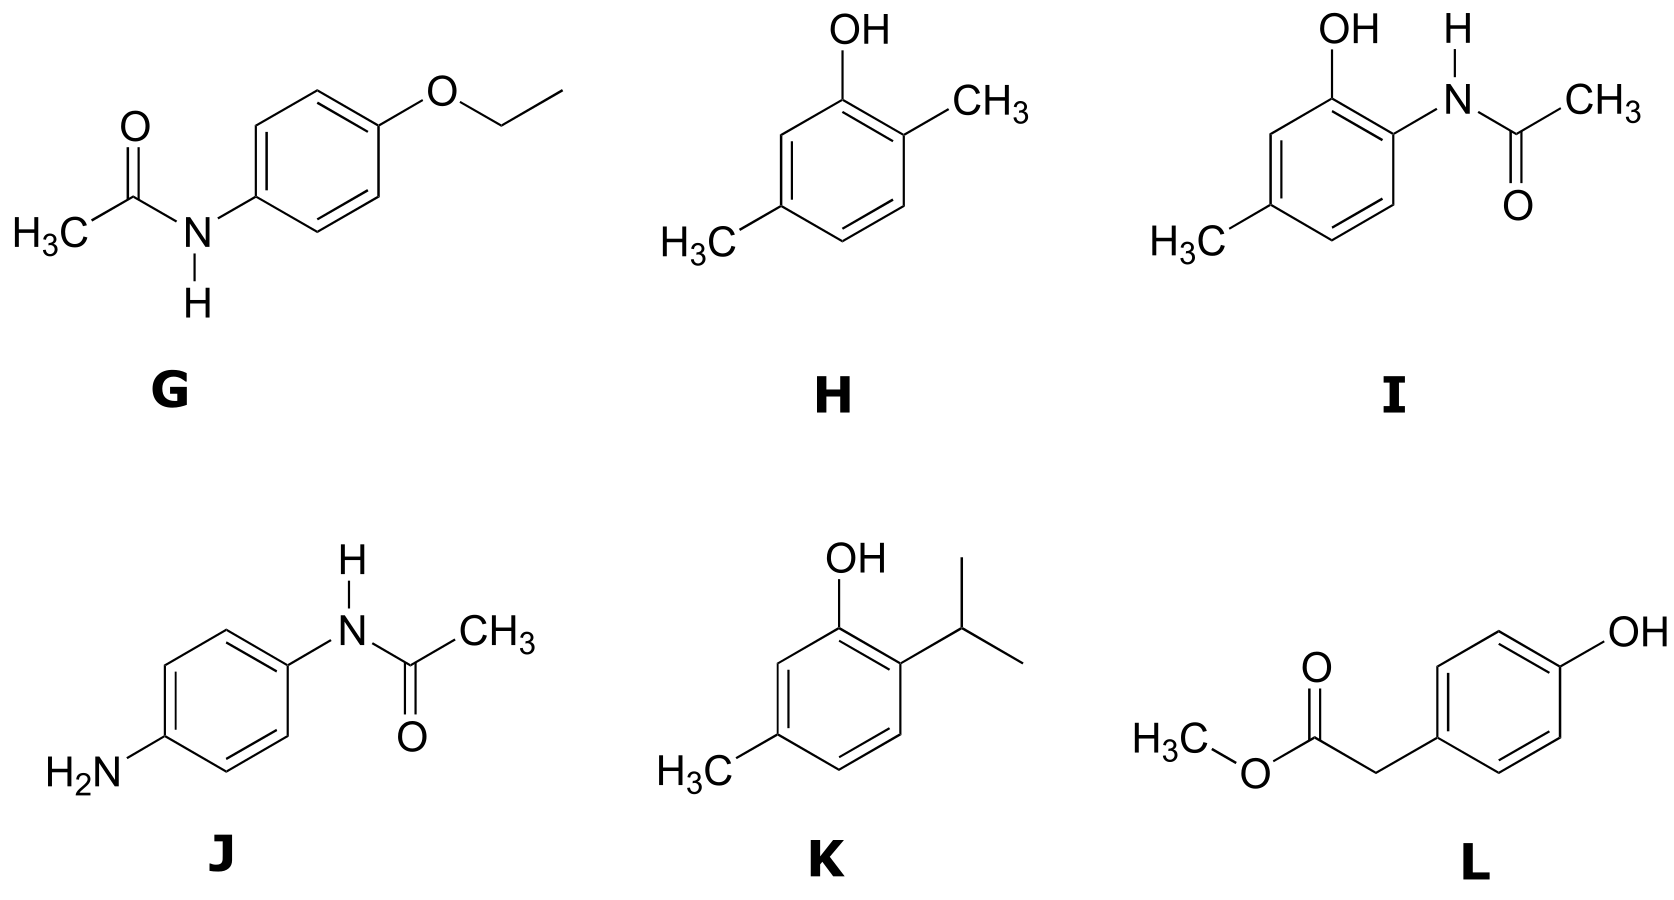
Spectrum 7: (2-265C, structure HH)
δ (ppm) |
splitting |
integration |
|---|---|---|
6.98 |
d |
1 |
6.64 |
d |
1 |
6.54 |
s |
1 |
4.95 |
s |
1 |
2.23 |
s |
3 |
2.17 |
s |
3 |
Spectrum 8: (2-266A, structure KK)
δ (ppm) |
splitting |
integration |
|---|---|---|
7.08 |
d |
1 |
6.72 |
d |
1 |
6.53 |
s |
1 |
4.81 |
s |
1 |
3.15 |
septet |
1 |
2.24 |
s |
3 |
1.22 |
d |
6 |
Spectrum 9: (2-1212B, structure LL)
δ (ppm) |
splitting |
integration |
|---|---|---|
7.08 |
d |
2 |
6.71 |
d |
2 |
6.54 |
s |
1 |
3.69 |
s |
3 |
3.54 |
s |
2 |
Spectrum 10: (2-1366A, structure GG)
δ (ppm) |
splitting |
integration |
|---|---|---|
9.63 |
s |
1 |
7.45 |
d |
2 |
6.77 |
d |
2 |
3.95 |
q |
2 |
2.05 |
s |
3 |
1.33 |
t |
3 |
Spectrum 11: (2-1366B, structure JJ)
δ (ppm) |
splitting |
integration |
|---|---|---|
9.49 |
s |
1 |
7.20 |
d |
2 |
6.49 |
d |
2 |
4.82 |
s |
2 |
1.963 |
s |
3 |
Spectrum 12: (2-1368C, structure II)
δ (ppm) |
splitting |
integration |
|---|---|---|
9.58 |
s(b) |
1 |
9.31 |
s |
1 |
7.36 |
d |
1 |
6.67 |
s |
1 |
6.55 |
d |
1 |
2.21 |
s |
3 |
2.11 |
s |
3 |
P5.5: Match the 1H-NMR spectra 13-18 to their corresponding structures M-R. Make complete peak assignments for all structures.
Structures:
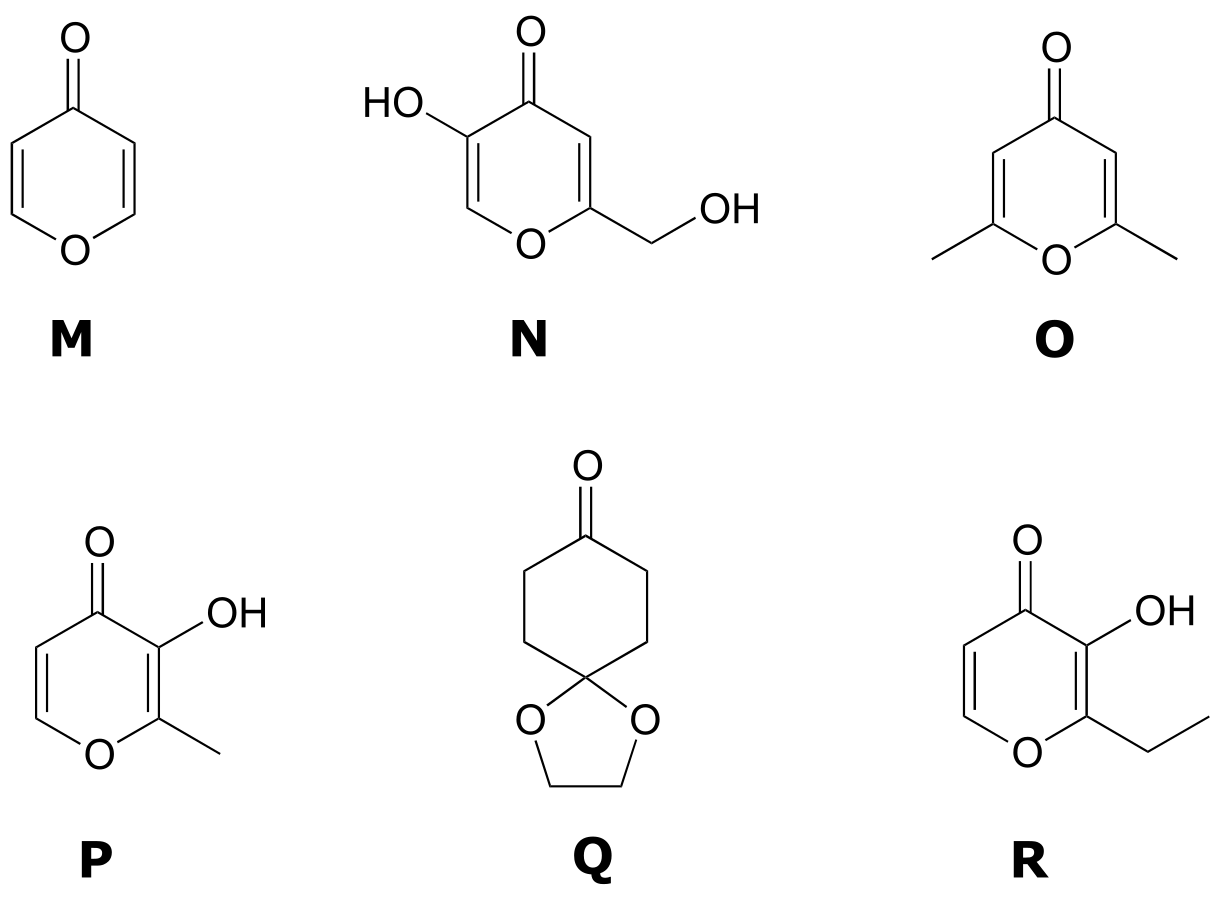
Spectrum 13: 1-723B (structure M)
δ (ppm) |
splitting |
integration |
|---|---|---|
8.15 |
d |
1 |
6.33 |
d |
1 |
Spectrum 14: 1-723C (structure O)
δ (ppm) |
splitting |
integration |
|---|---|---|
6.05 |
s |
1 |
2.24 |
s |
3 |
Spectrum 15: (1-724A, structure P)
δ (ppm) |
splitting |
integration |
|---|---|---|
8.57 |
s (b) |
1 |
7.89 |
d |
1 |
6.30 |
d |
1 |
2.28 |
s |
3 |
δ (ppm) |
splitting |
integration |
|---|---|---|
9.05 |
s (b) |
1 |
8.03 |
s |
1 |
6.34 |
s |
1 |
5.68 |
s (b) |
1 |
4.31 |
s |
2 |
Spectrum 17: (1-724B, structure R)
δ (ppm) |
splitting |
integration |
|---|---|---|
7.76 |
d |
1 |
7.57 |
s (b) |
1 |
6.44 |
d |
1 |
2.78 |
q |
2 |
1.25 |
t |
3 |
Spectrum 18: (1-722-C, structure Q)
δ (ppm) |
splitting |
integration |
|---|---|---|
4.03 |
s |
1 |
2.51 |
t |
1 |
2.02 |
t |
1 |
P5.6: Match the 1H-NMR spectra 19-24 below to their corresponding structures S-X. Make complete peak assignments for all structures.
Structures:
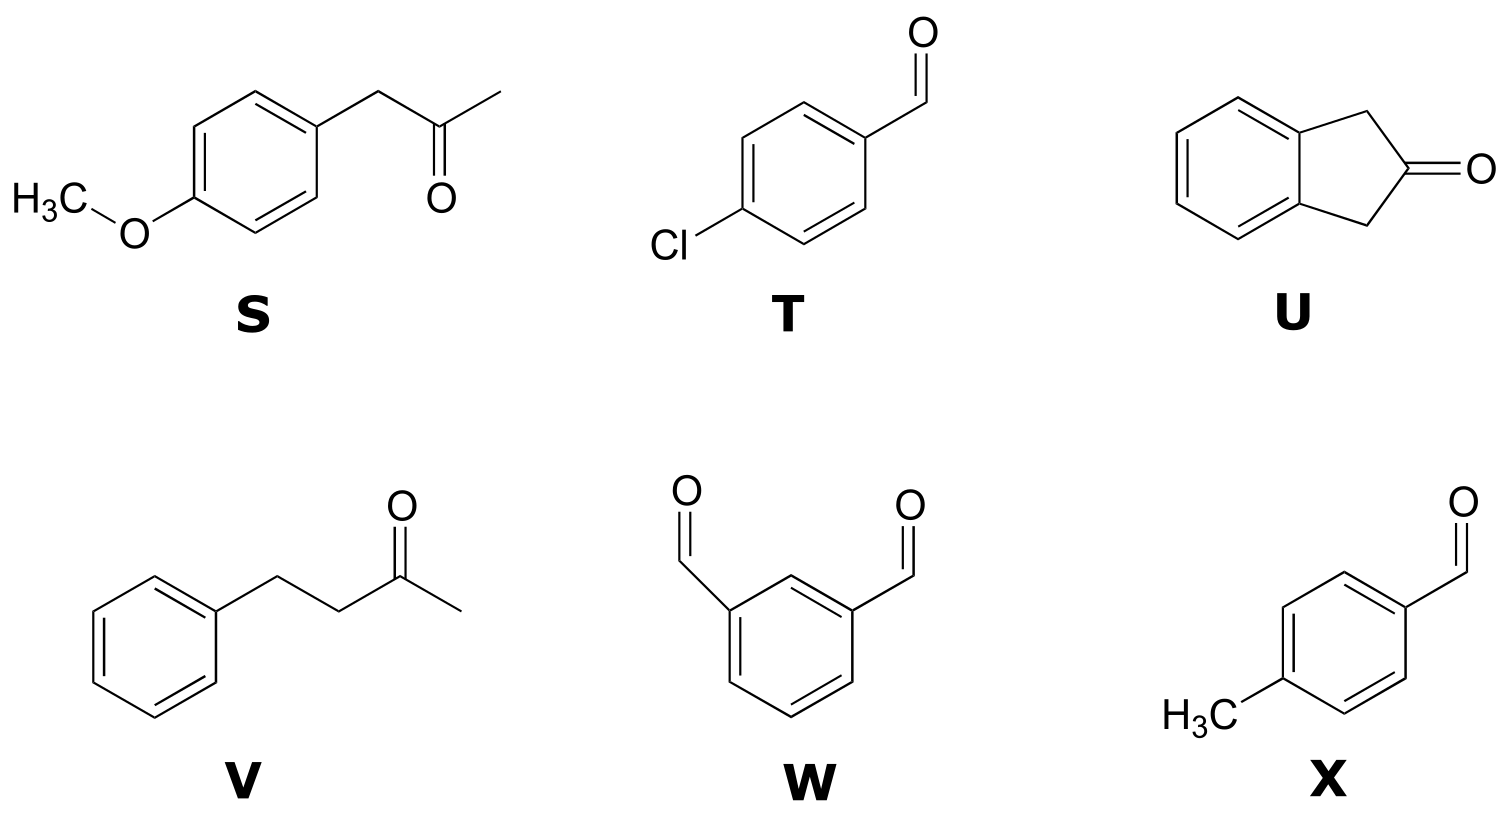
Spectrum 19: (2-938C, structure X)
δ (ppm) |
splitting |
integration |
|---|---|---|
9.94 |
s |
1 |
7.77 |
d |
2 |
7.31 |
d |
2 |
2.43 |
s |
3 |
Spectrum 20: (2-938B, structure W)
δ (ppm) |
splitting |
integration |
|---|---|---|
10.14 |
s |
2 |
8.38 |
s |
1 |
8.17 |
d |
2 |
7.75 |
t |
1 |
Spectrum 21:: (2-940B, structure T)
δ (ppm) |
splitting |
integration |
|---|---|---|
9.98 |
s |
1 |
7.81 |
d |
2 |
7.50 |
d |
2 |
Spectrum 22: (2-789A, structure V)
δ (ppm) |
splitting |
integration |
|---|---|---|
7.15-7.29 |
m |
2.5 |
2.86 |
t |
1 |
2.73 |
t |
1 |
2.12 |
s |
1.5 |
Spectrum 23: (2-794B, structure S)
δ (ppm) |
splitting |
integration |
|---|---|---|
7.10 |
d |
1 |
6.86 |
d |
1 |
3.78 |
s |
1.5 |
3.61 |
s |
1 |
2.12 |
s |
1.5 |
Spectrum 24: (2-791C, structure U)
δ (ppm) |
splitting |
integration |
|---|---|---|
7.23-7.30 |
m |
1 |
3.53 |
s |
1 |
P5.7: Match the 1H-NMR spectra 25-30 below to their corresponding structures AA-FF.
Structures:
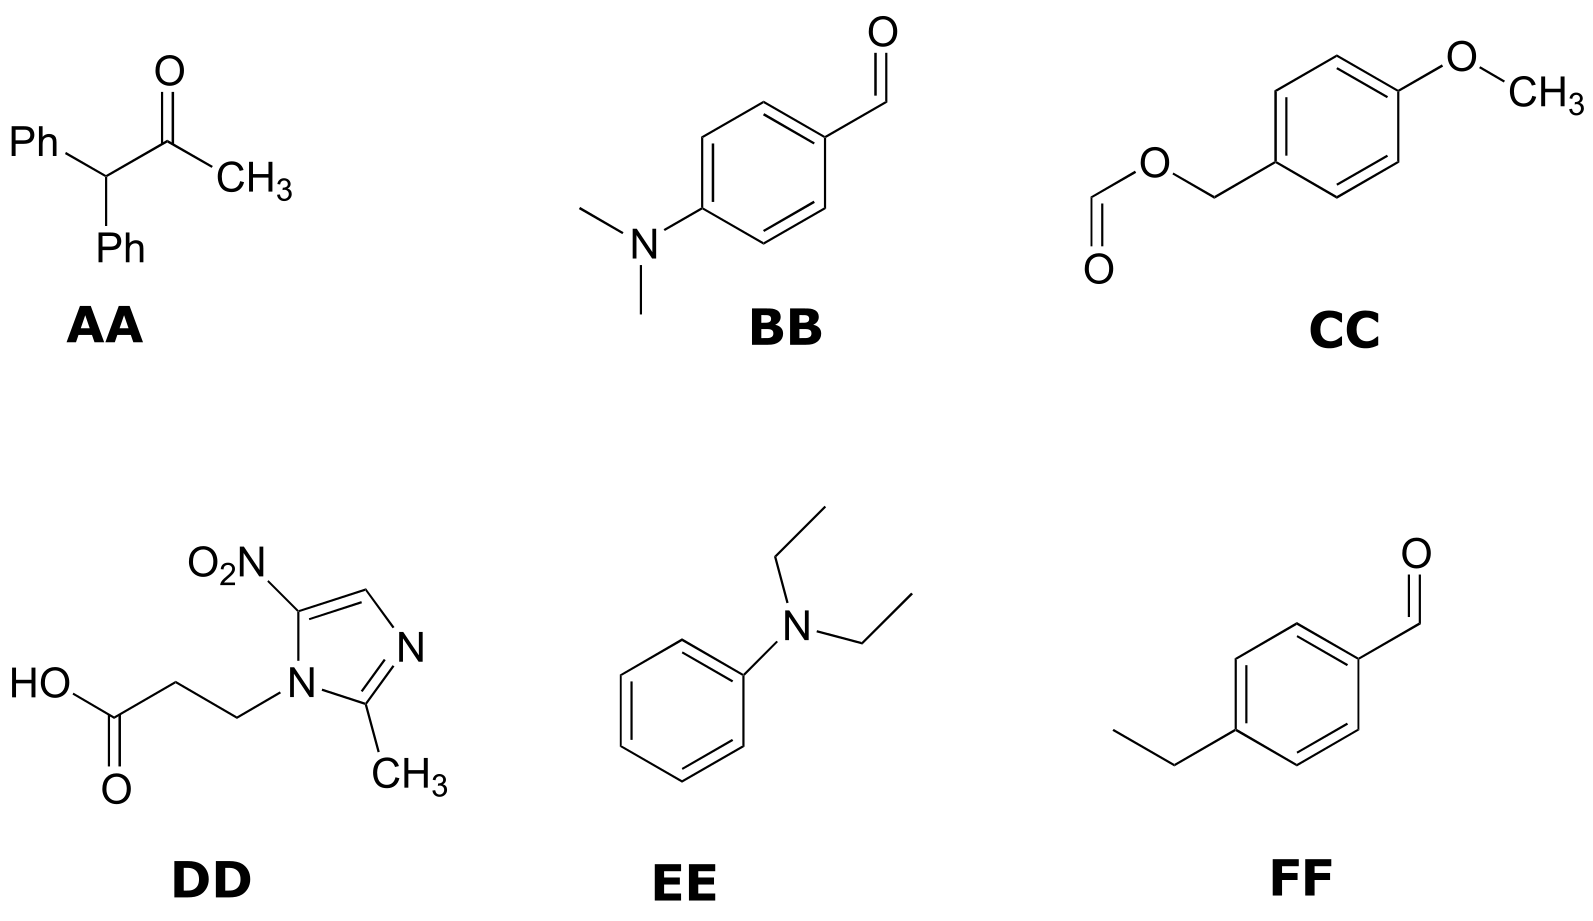
Spectrum 25: (2-939A, structure FF)
δ (ppm) |
splitting |
integration |
|---|---|---|
9.96 |
s |
1 |
7.79 |
d |
2 |
7.33 |
d |
2 |
2.72 |
q |
2 |
1.24 |
t |
3 |
Spectrum 26: (2-943C, structure BB)
δ (ppm) |
splitting |
integration |
|---|---|---|
9.73 |
s |
1 |
7.71 |
d |
2 |
6.68 |
d |
2 |
3.06 |
s |
6 |
Spectrum 27: (2-790A, structure AA)
δ (ppm) |
splitting |
integration |
|---|---|---|
11.2 (b) |
s |
1 |
7.20-7.35 |
m |
10 |
5.12 |
s |
1 |
2.22 |
s |
3 |
Spectrum 28: (2-1201A, structure CC)
δ (ppm) |
splitting |
integration |
|---|---|---|
8.08 |
s |
1 |
7.29 |
d |
2 |
6.87 |
d |
2 |
5.11 |
s |
2 |
3.78 |
s |
3 |
Spectrum 29: (2-455B, structure EE)
δ (ppm) |
splitting |
integration |
|---|---|---|
7.18 |
d |
1 |
6.65 |
m |
1.5 |
3.2 |
q |
2 |
1.13 |
t |
3 |
Spectrum 30: (3-85C, structure DD)
δ (ppm) |
splitting |
integration |
|---|---|---|
8.32 |
s |
1 |
4.19 |
t |
2 |
2.83 |
t |
2 |
2.40 |
s |
3 |
P5.8:
13C-NMR data is given for the molecules shown below. Complete the peak assignment column of each NMR data table.
a) (1-895C)
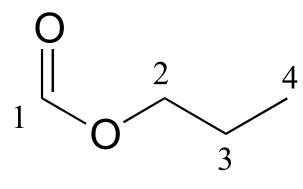
δ (ppm) |
carbon #(s) |
|
|---|---|---|
161.12 |
CH |
|
65.54 |
CH2 |
|
21.98 |
CH2 |
|
10.31 |
CH3 |
b) (1-735A) (check splitting)
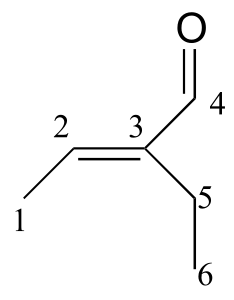
δ (ppm) |
carbon #(s) |
|
|---|---|---|
194.72 |
C |
|
149.10 |
C |
|
146.33 |
CH |
|
16.93 |
CH2 |
|
14.47 |
CH3 |
|
12.93 |
CH3 |
c) (1-938)
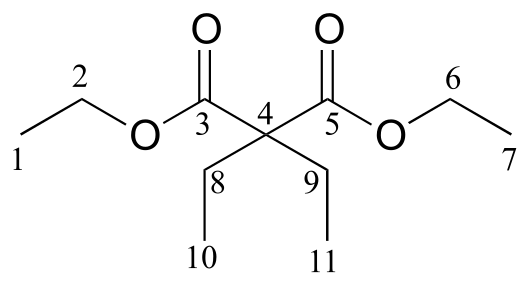
δ (ppm) |
carbon #(s) |
|
|---|---|---|
171.76 |
C |
|
60.87 |
CH2 |
|
58.36 |
C |
|
24.66 |
CH2 |
|
14.14 |
CH3 |
|
8.35 |
CH3 |
d) (2-1212B)
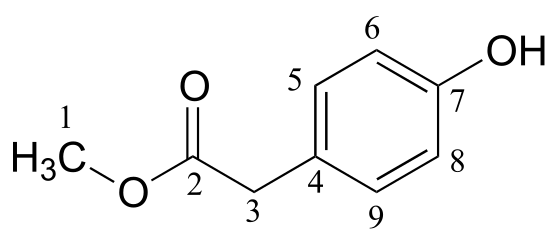
δ (ppm) |
carbon #(s) |
|
|---|---|---|
173.45 |
C |
|
155.01 |
C |
|
130.34 |
CH |
|
125.34 |
C |
|
115.56 |
CH |
|
52.27 |
CH3 |
|
40.27 |
CH2 |
e) (2-455B)
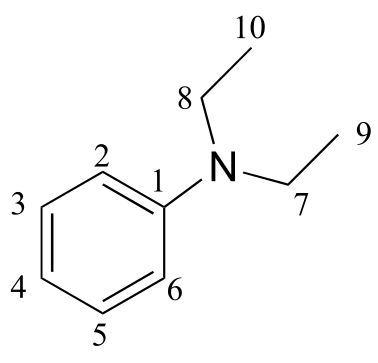
δ (ppm) |
carbon #(s) |
|
|---|---|---|
147.79 |
C |
|
129.18 |
CH |
|
115.36 |
CH |
|
111.89 |
CH |
|
44.29 |
CH2 |
|
12.57 |
CH3 |
P5.9: Use the NMR data given to deduce structures.
a ) Molecular formula: C5H8O
1-734A
1H-NMR:
δ (ppm) |
splitting |
integration |
|---|---|---|
9.56 |
s |
1 |
6.25 |
d |
1 |
5.99 |
d |
1 |
2.27 |
q |
2 |
1.18 |
t |
3 |
13C-NMR
δ (ppm) |
|
|---|---|
194.60 |
CH |
151.77 |
C |
132.99 |
CH2 |
20.91 |
CH2 |
11.92 |
CH3 |
b) Molecular formula: C7H14O2
1-905B (IR 362E)
1H-NMR:
δ (ppm) |
splitting |
integration |
|---|---|---|
3.85 |
d |
2 |
2.32 |
q |
2 |
1.93 |
m |
1 |
1.14 |
t |
3 |
0.94 |
d |
6 |
13C-NMR
δ (ppm) |
|
|---|---|
174.47 |
C |
70.41 |
CH2 |
27.77 |
CH |
27.64 |
CH2 |
19.09 |
CH3 |
9.21 |
CH3 |
c) Molecular weight: 88
1-170B (IR: 68D) C5H12O
Combustion analysis:
C: 68.2%
H: 13.6%
IR: ~3349 cm-1 (broad)
1H-NMR:
δ (ppm) |
splitting |
integration |
|---|---|---|
3.38 |
s |
2H |
2.17 |
s |
1H |
0.91 |
s |
9H |
13C-NMR
δ (ppm) |
|
|---|---|
73.35 |
CH2 |
32.61 |
C |
26.04 |
CH3 |
d) Molecular weight: 148
2-789B (IR: 848C) C10H12O
Combustion analysis:
C: 81.1%
H: 8.1%
IR: 1713 cm-1 (strong)
1H-NMR:
δ (ppm) |
splitting |
integration |
|---|---|---|
7.18-7.35 |
m |
2.5 |
3.66 |
s |
1 |
2.44 |
q |
1 |
1.01 |
t |
1.5 |
13C-NMR
δ (ppm) |
|
|---|---|
208.79 |
C |
134.43 |
C |
129.31 |
CH |
128.61 |
CH |
126.86 |
CH |
49.77 |
CH2 |
35.16 |
CH2 |
7.75 |
CH3 |
P5.10: You obtain the following data for an unknown sample. Deduce its structure.
Combustion analysis: C (69.7%); H (11.7%)
Mass Spectrometry:
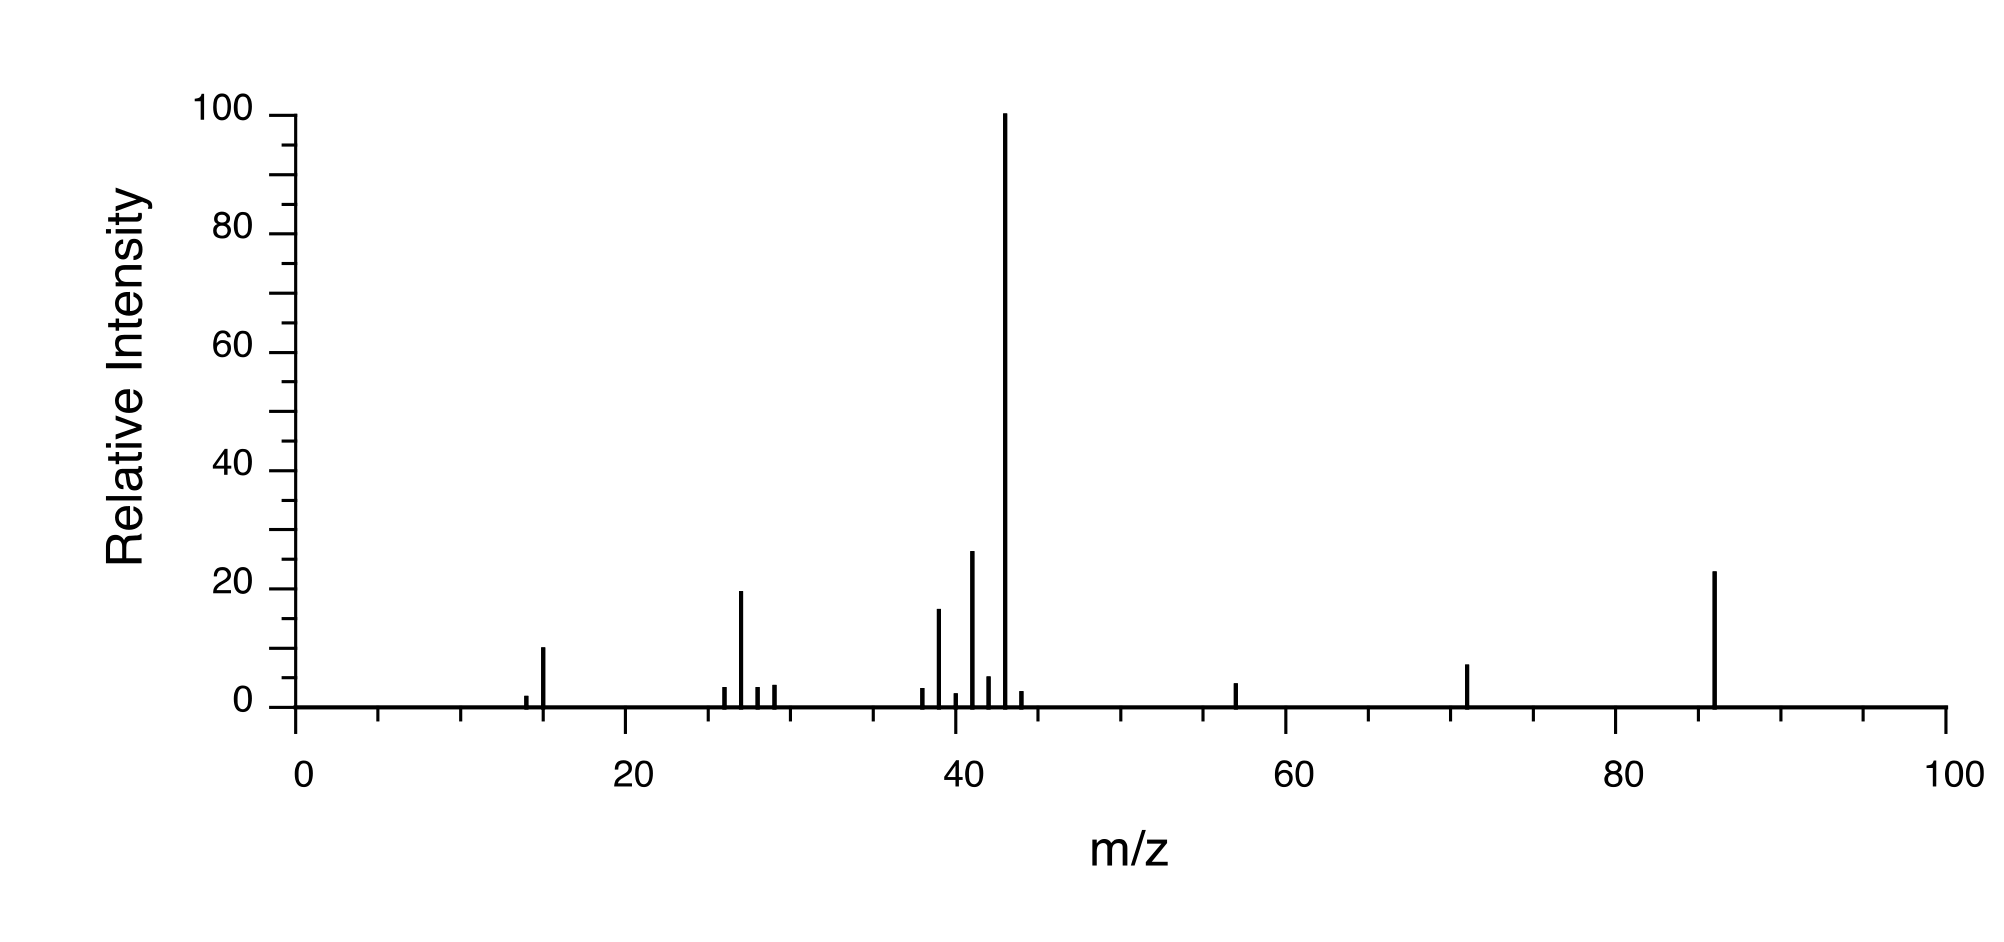
(3-methyl-2-butanone)
1H-NMR:
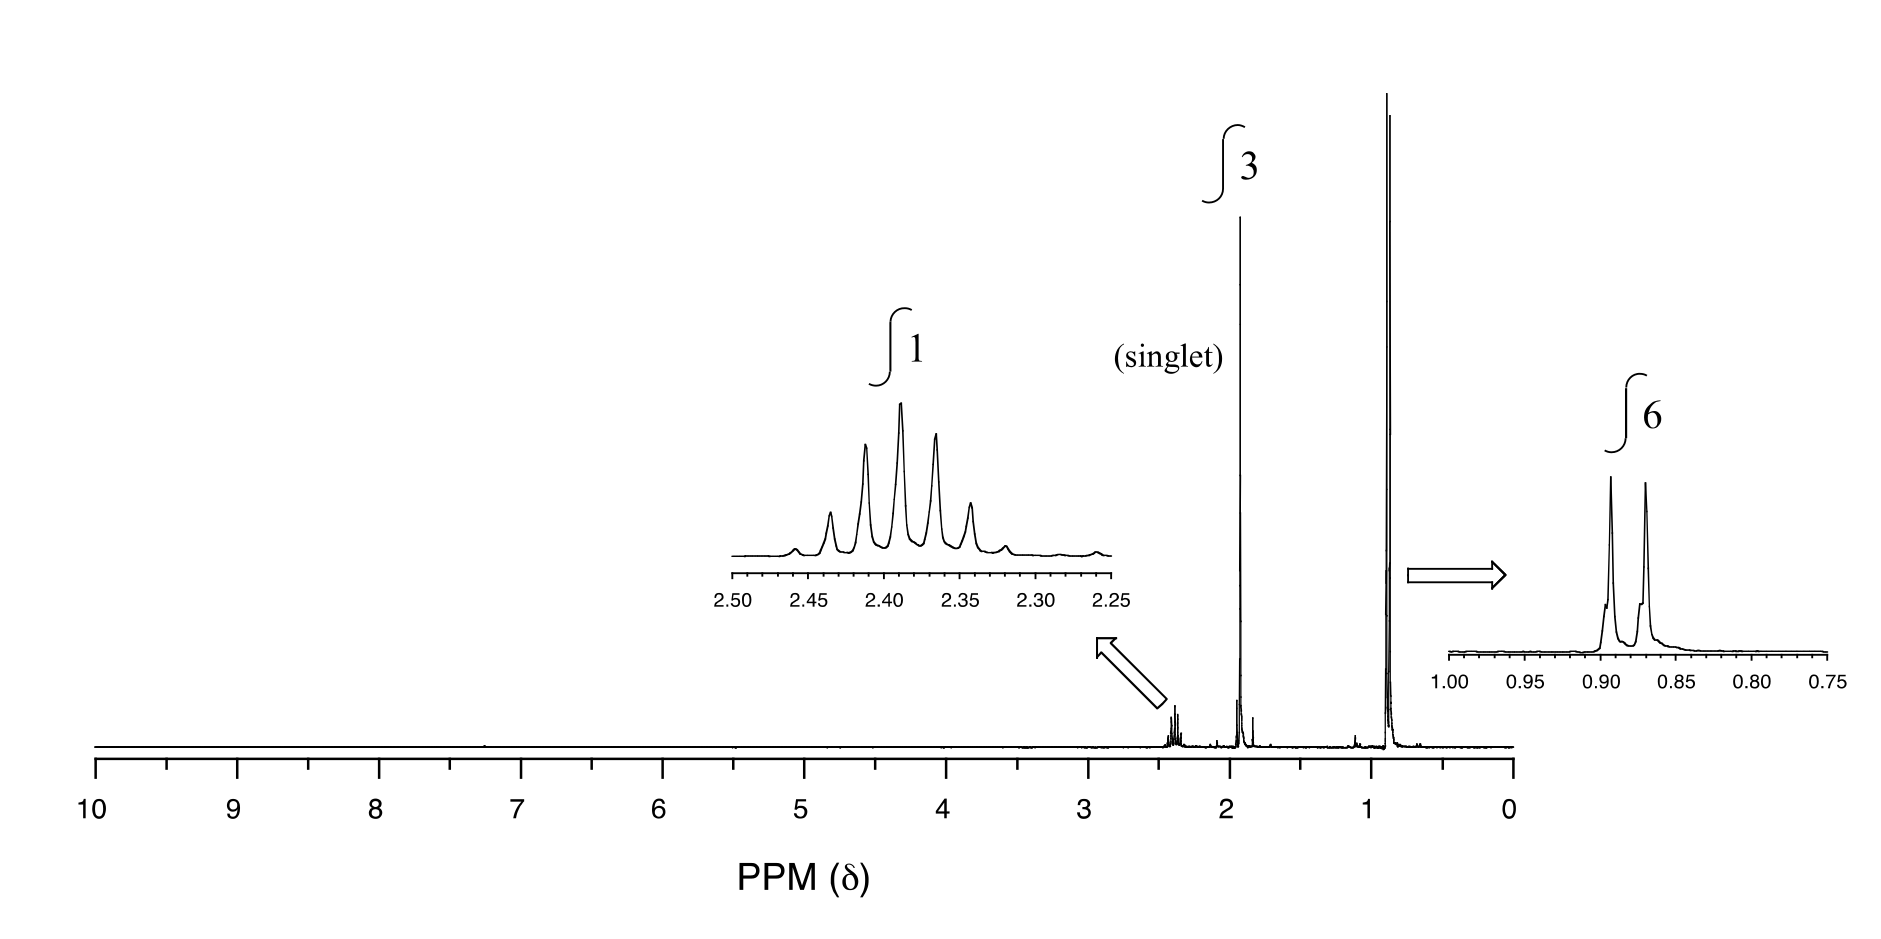
13C-NMR:
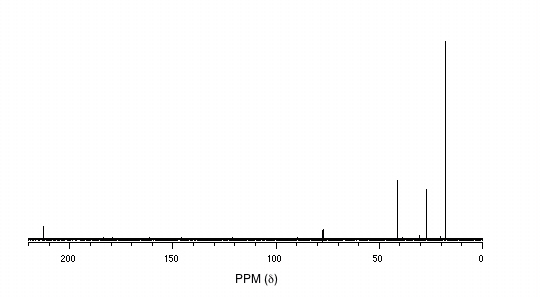
P5.11: You take a1H-NMR spectrum of a sample that comes from a bottle of 1-bromopropane. However, you suspect that the bottle might be contaminated with 2-bromopropane. The NMR spectrum shows the following peaks:
δ (ppm) |
splitting |
Integration |
|---|---|---|
4.3 |
septet |
0.0735 |
3.4 |
t |
0.661 |
1.9 |
sextet |
0.665 |
1.7 |
d |
0.441 |
1.0 |
t |
1.00 |
How badly is the bottle contaminated? Specifically, what percent of the molecules in the bottle are 2-bromopropane?
P5.12:
a) The proton-decoupled 13C-NMR spectrum of isopentenyl diphosphate, the building block compound for isoprenoids (see section 1.3) is composed of five signals, two of which are doublets. Explain.
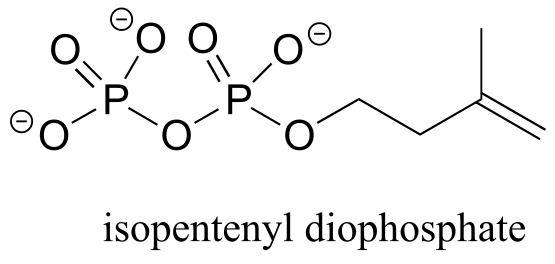
b) Recall that other magnetically active nuclei besides 1H and 13C can be observed by NMR. Without trying to predict chemical shift values, describe what the 31P-NMR spectrum for isopentenyl diphosphate might look like.